
Line Graphs
The Line Graph
Tracking Continuous Trends
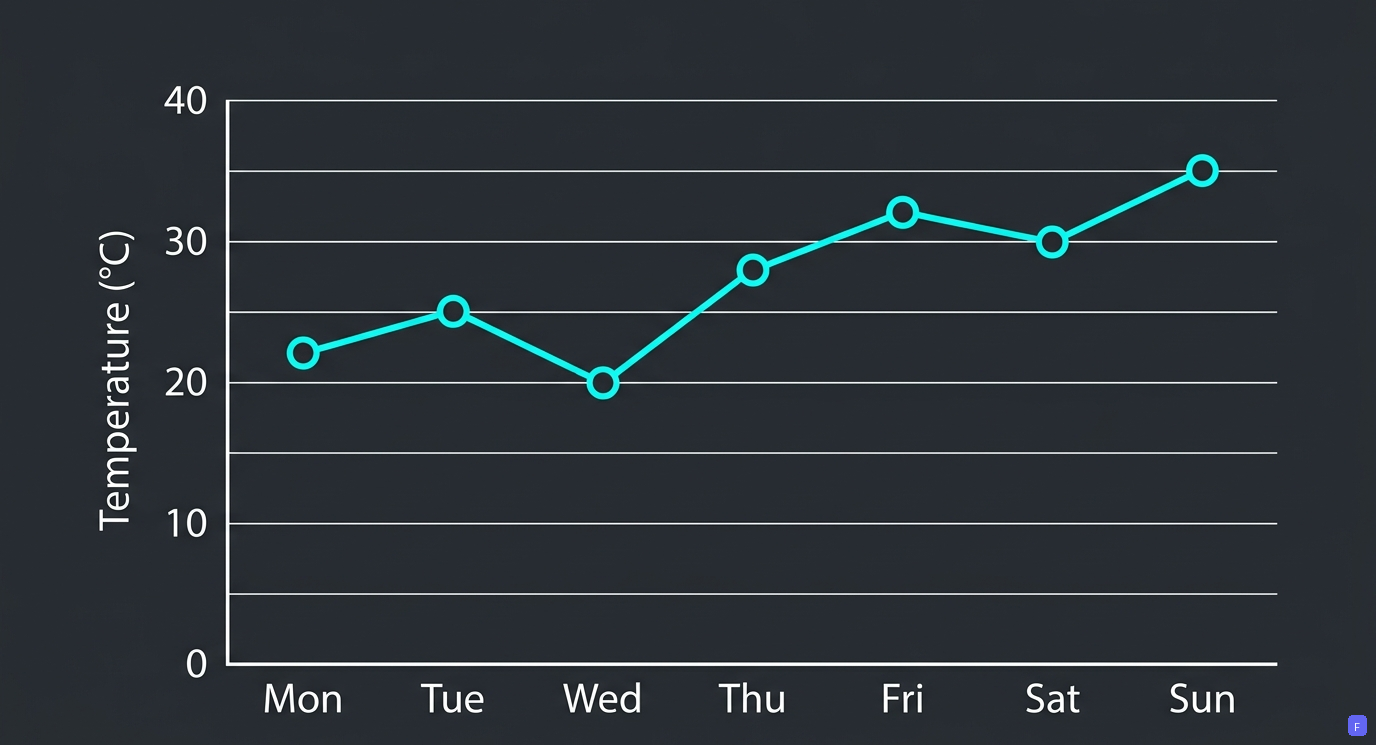
A line graph uses points connected by straight line segments to show how a value changes continuously over time.
Key Points
- Used to show how data changes over time, like daily temperatures or monthly savings.
- Dots (points) are marked on the grid and joined together using straight lines.
- Helps you quickly see if numbers are going up, going down, or staying the same.
Olympiad Fact
Line graphs are best for continuous time data; for separate categories like favorite fruits or colors, a bar graph is used instead.
Elements: Points, Lines, and Axes
The Grid Framework
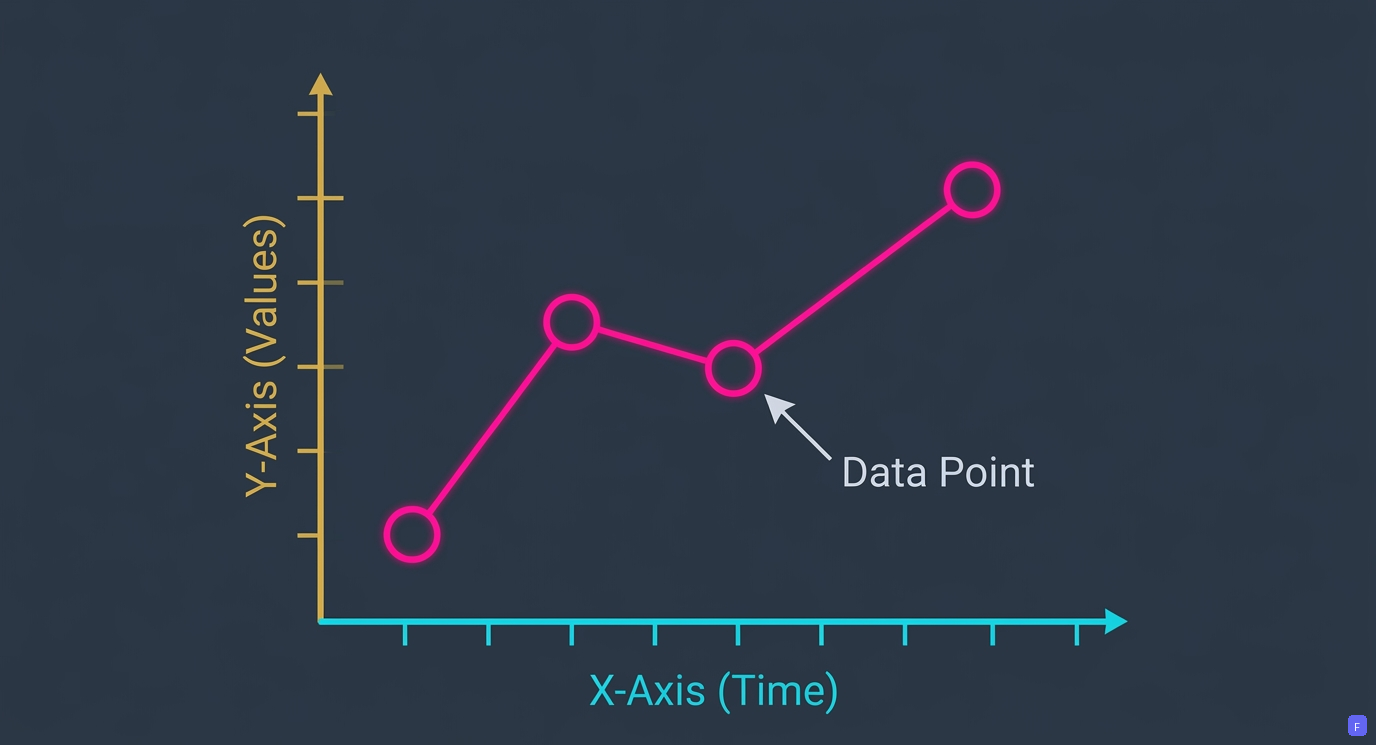
A line graph is drawn on two perpendicular lines called axes, with plotted dots joined together by line segments.
Key Points
- The horizontal line at the bottom (X-axis) usually shows the time period (days, months, or hours).
- The vertical line on the side (Y-axis) shows the number scale (measurements or quantities).
- Each dot is placed where the time line and number line meet on the grid.
Olympiad Fact
The point where the X-axis and Y-axis meet is the origin , which represents zero on both scales.
Reading the Direction of Lines
Going Up, Down, or Flat
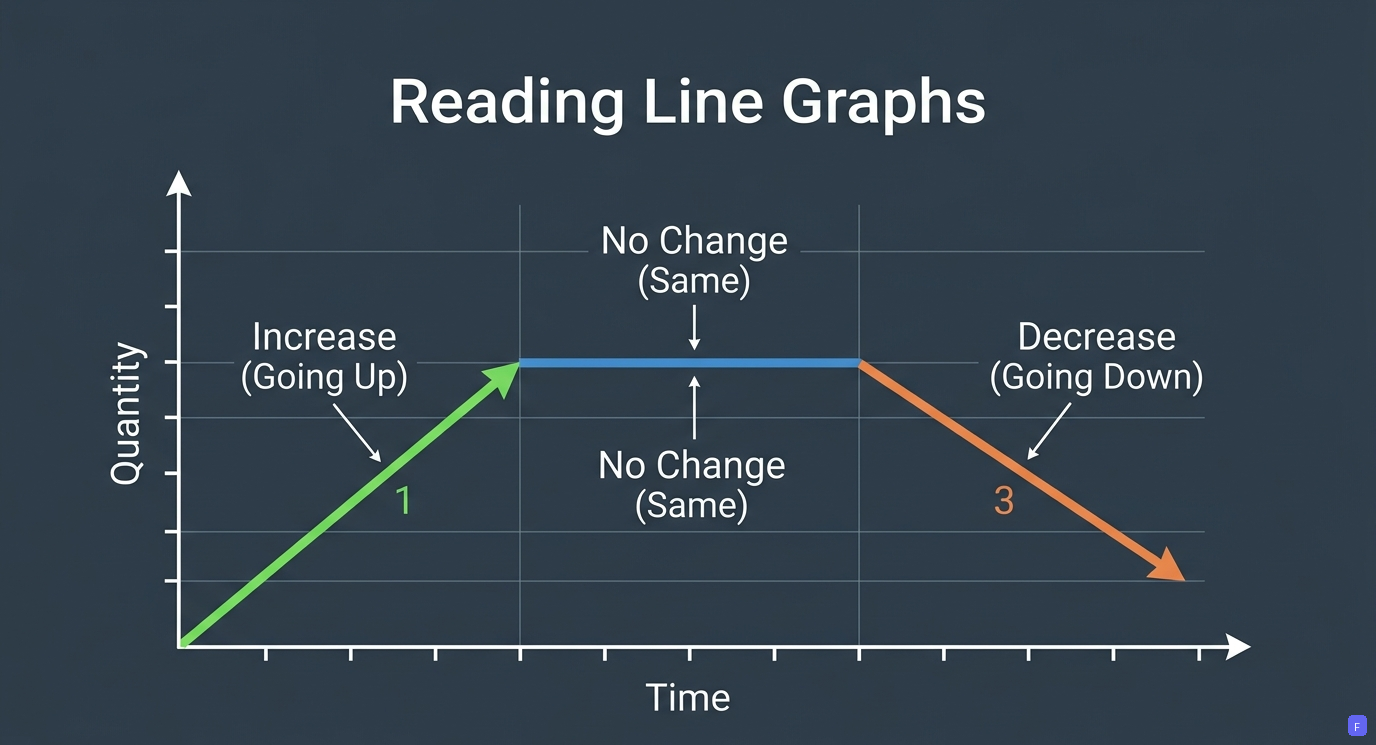
You can tell what happened to the numbers simply by looking at which way the line points.
Key Points
- A line going upwards (rising from left to right) means the value increased.
- A line going downwards (falling from left to right) means the value decreased.
- A completely flat horizontal line means there was no change at all.
Olympiad Fact
A steeper upward line means the value grew much faster compared to a gentle slope!
Swipe to skip‹