
Pictographs and Visual Representation
The Pictograph
Visual Data at a Glance

Key Points
- Every category in a pictograph has a heading to show what data is being represented.
- Relevant symbols are used to make comparisons immediately obvious.
- Pictographs are much more elaborate and easier to interpret than plain numbers in a list.
Olympiad Fact
In Olympiad questions, pictographs often use symbols to compare items; always look for the row with the most symbols to identify the maximum category instantly.
The Key of a Pictograph
The Map Legend for Symbols

Key Points
- The key acts as the scale factor to translate picture symbols into real numerical values.
- A single picture symbol can represent unit, units, or even units.
- The key is usually placed clearly at the bottom or corner of the pictograph.
Olympiad Fact
Olympiad exams occasionally hide or omit the key in problem statements; always check the legend box first to ensure your calculations are scaled correctly!
Multi-Unit Scaling
Handling Large Frequencies
Key Points
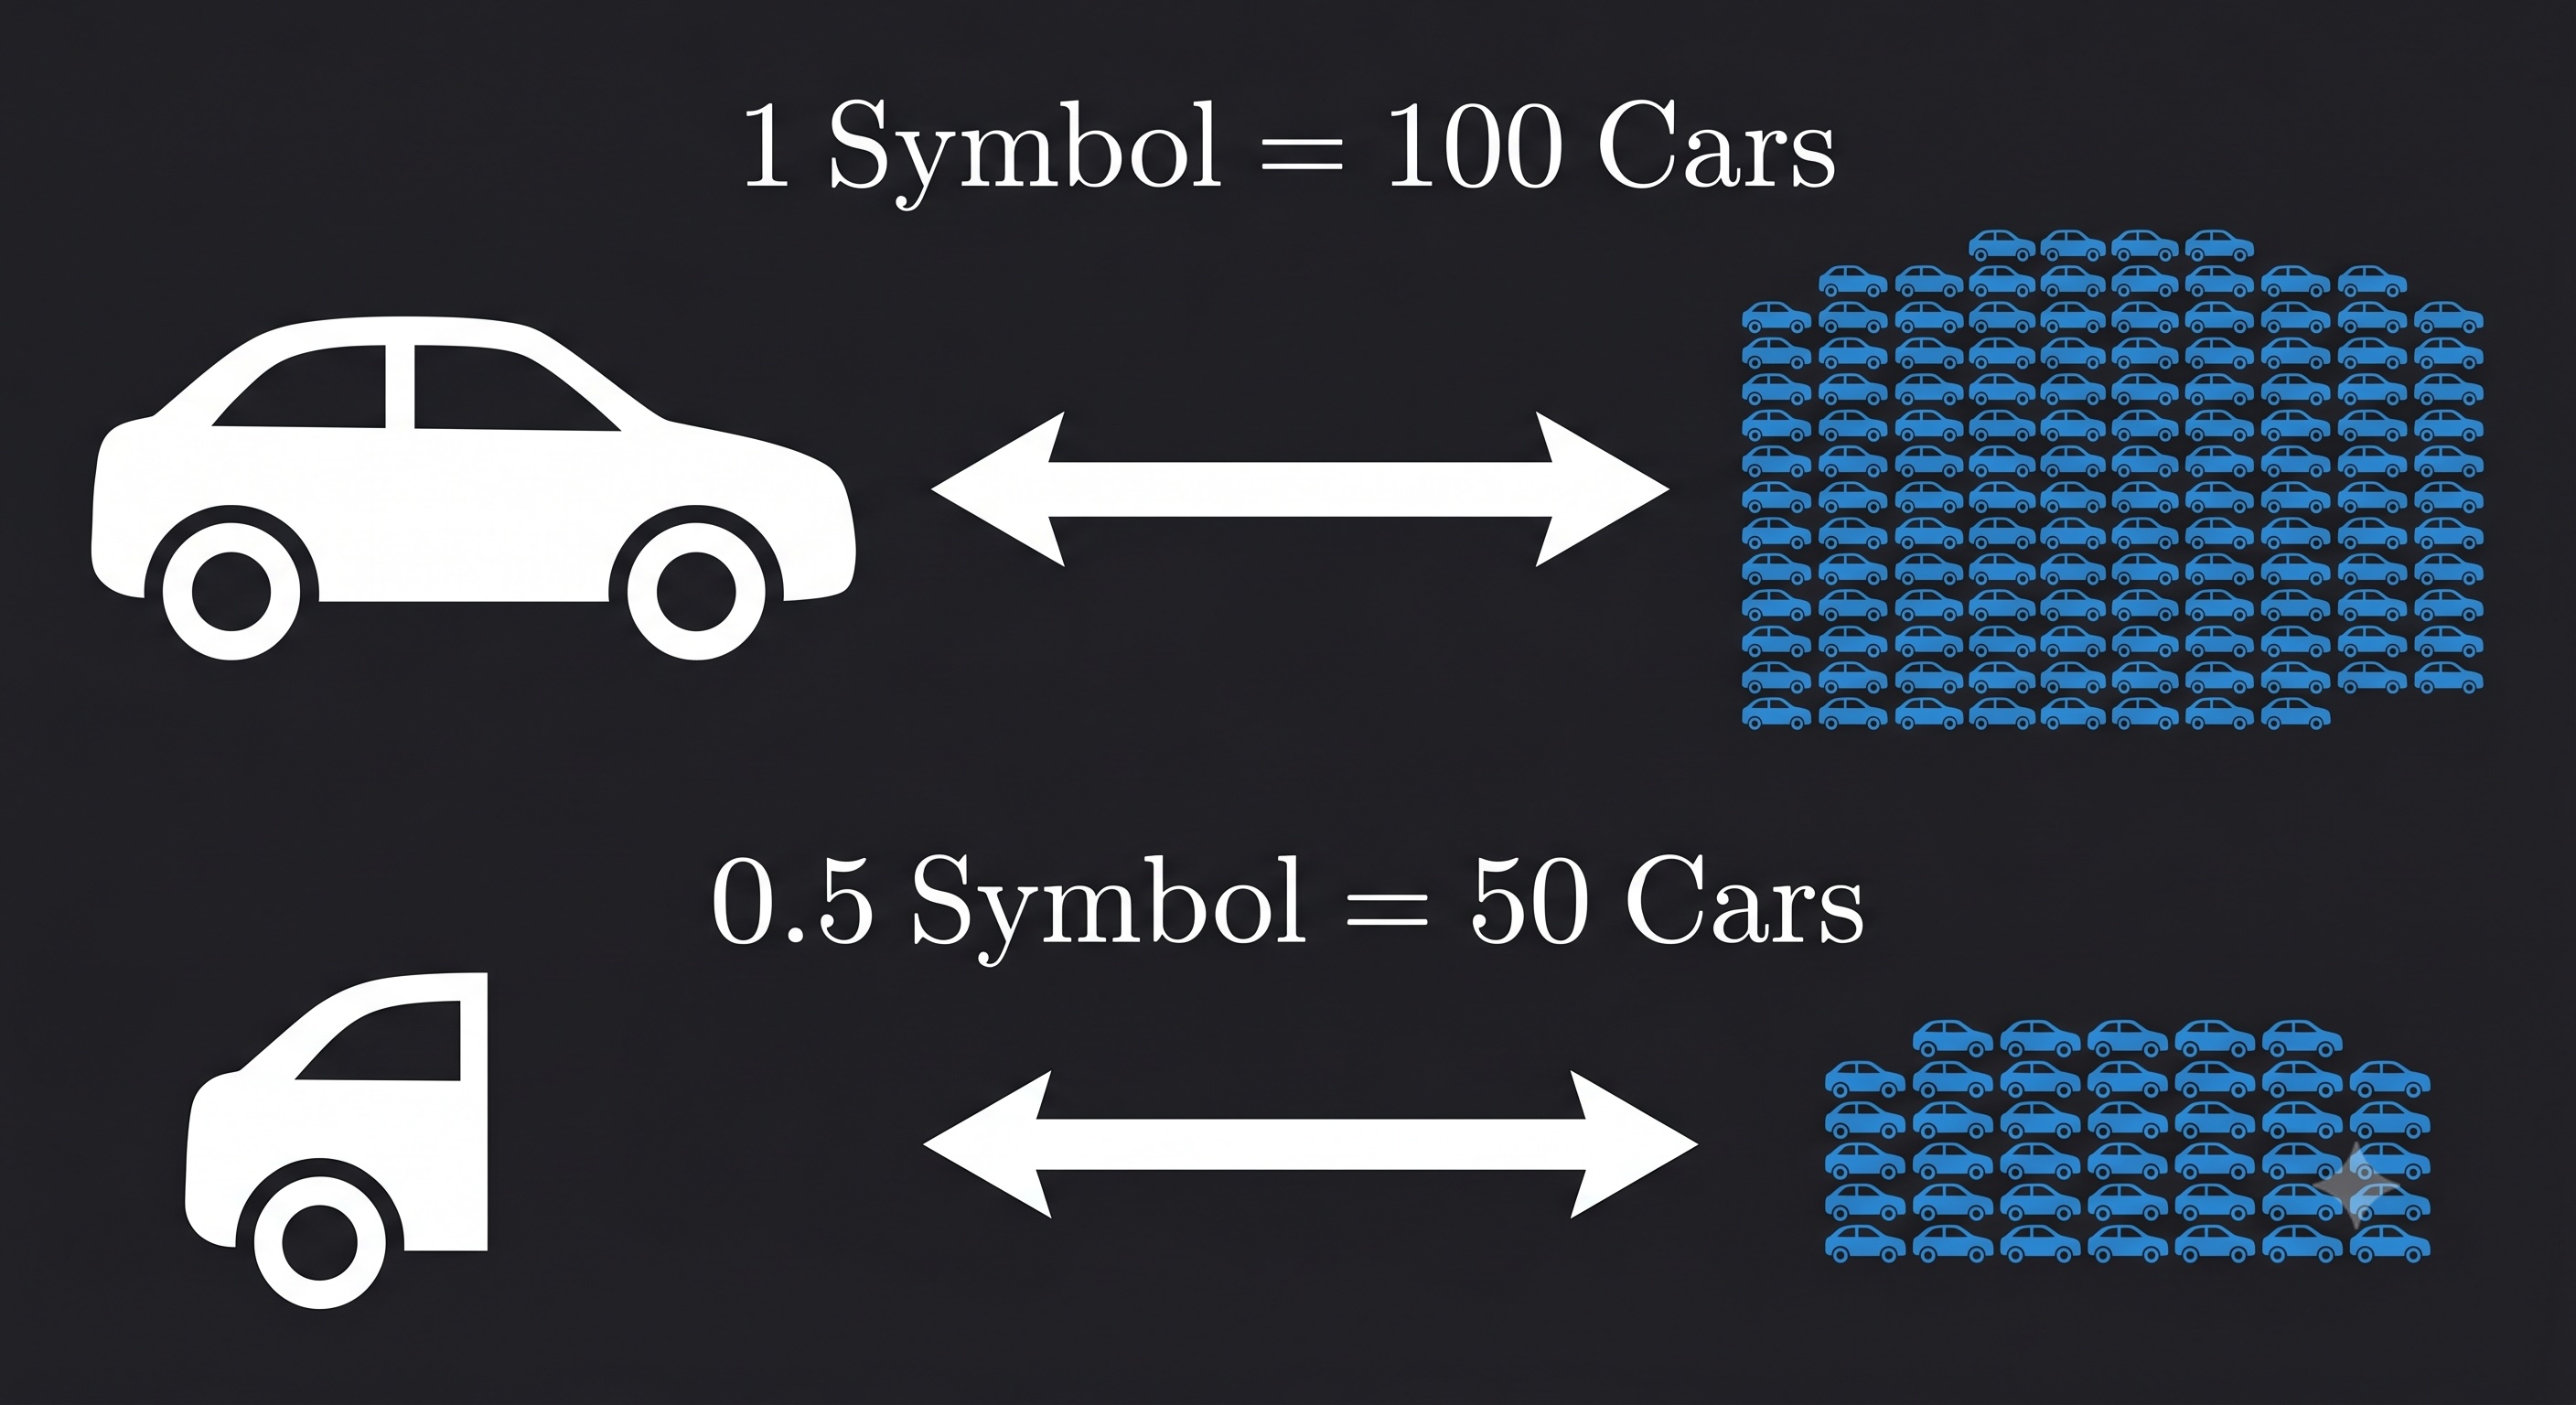
- For large factory productions, one car symbol can be scaled to represent exactly cars.
- Fractional values can be shown by drawing half of a symbol, such as a half-car representing cars.
- Using a scale keeps the pictograph compact, clean, and easy to fit on a single page.
Olympiad Fact
To find the total frequency in a scaled pictograph, sum the total number of symbols first, then multiply that sum by the scale factor in the key!
Interpreting Pictographs
Drawing Math Conclusions
Key Points
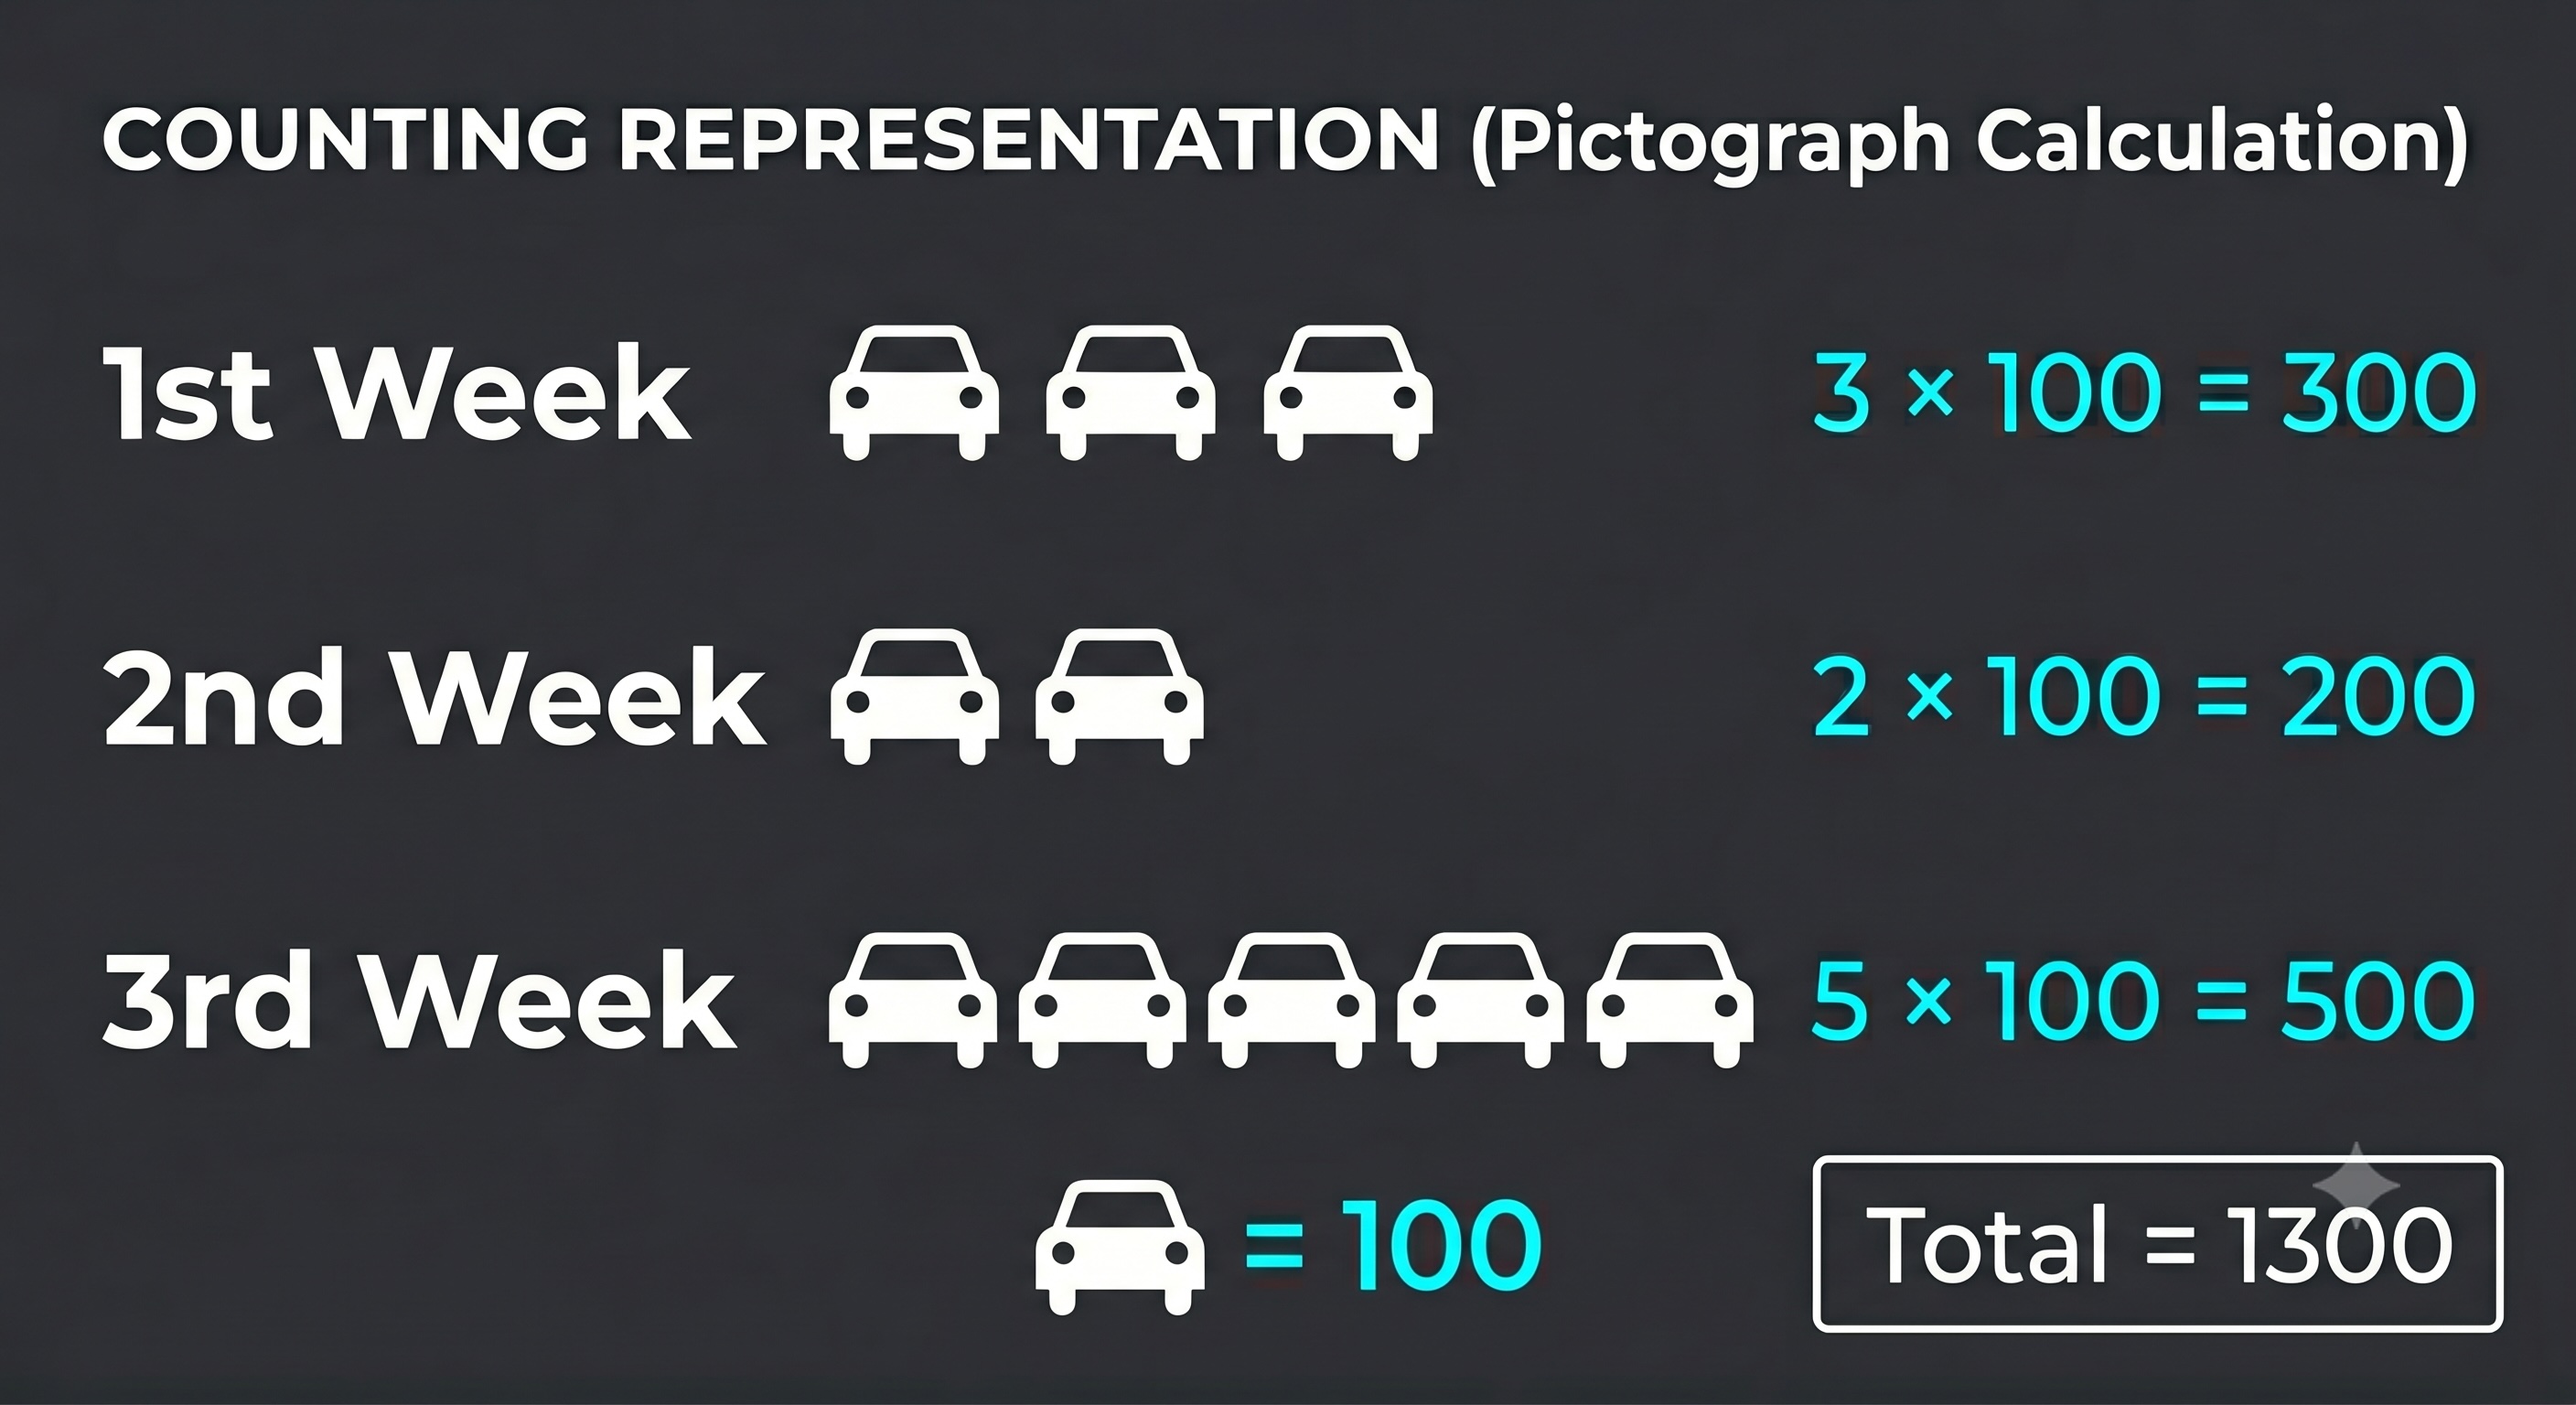
- Step 1: Identify what the pictograph represents by reading its heading.
- Step 2: Read the key to find the exact multiplier value for each symbol.
- Step 3: Multiply the count of symbols in each row by the key value to find the real totals.
Olympiad Fact
To find the difference between two categories in a scaled pictograph, subtract the number of symbols first, and then multiply the difference by the key. This prevents tedious multi-step calculations!