
Collection and Organisation of Data
Collection of Data
Recording the First Observations
Key Points
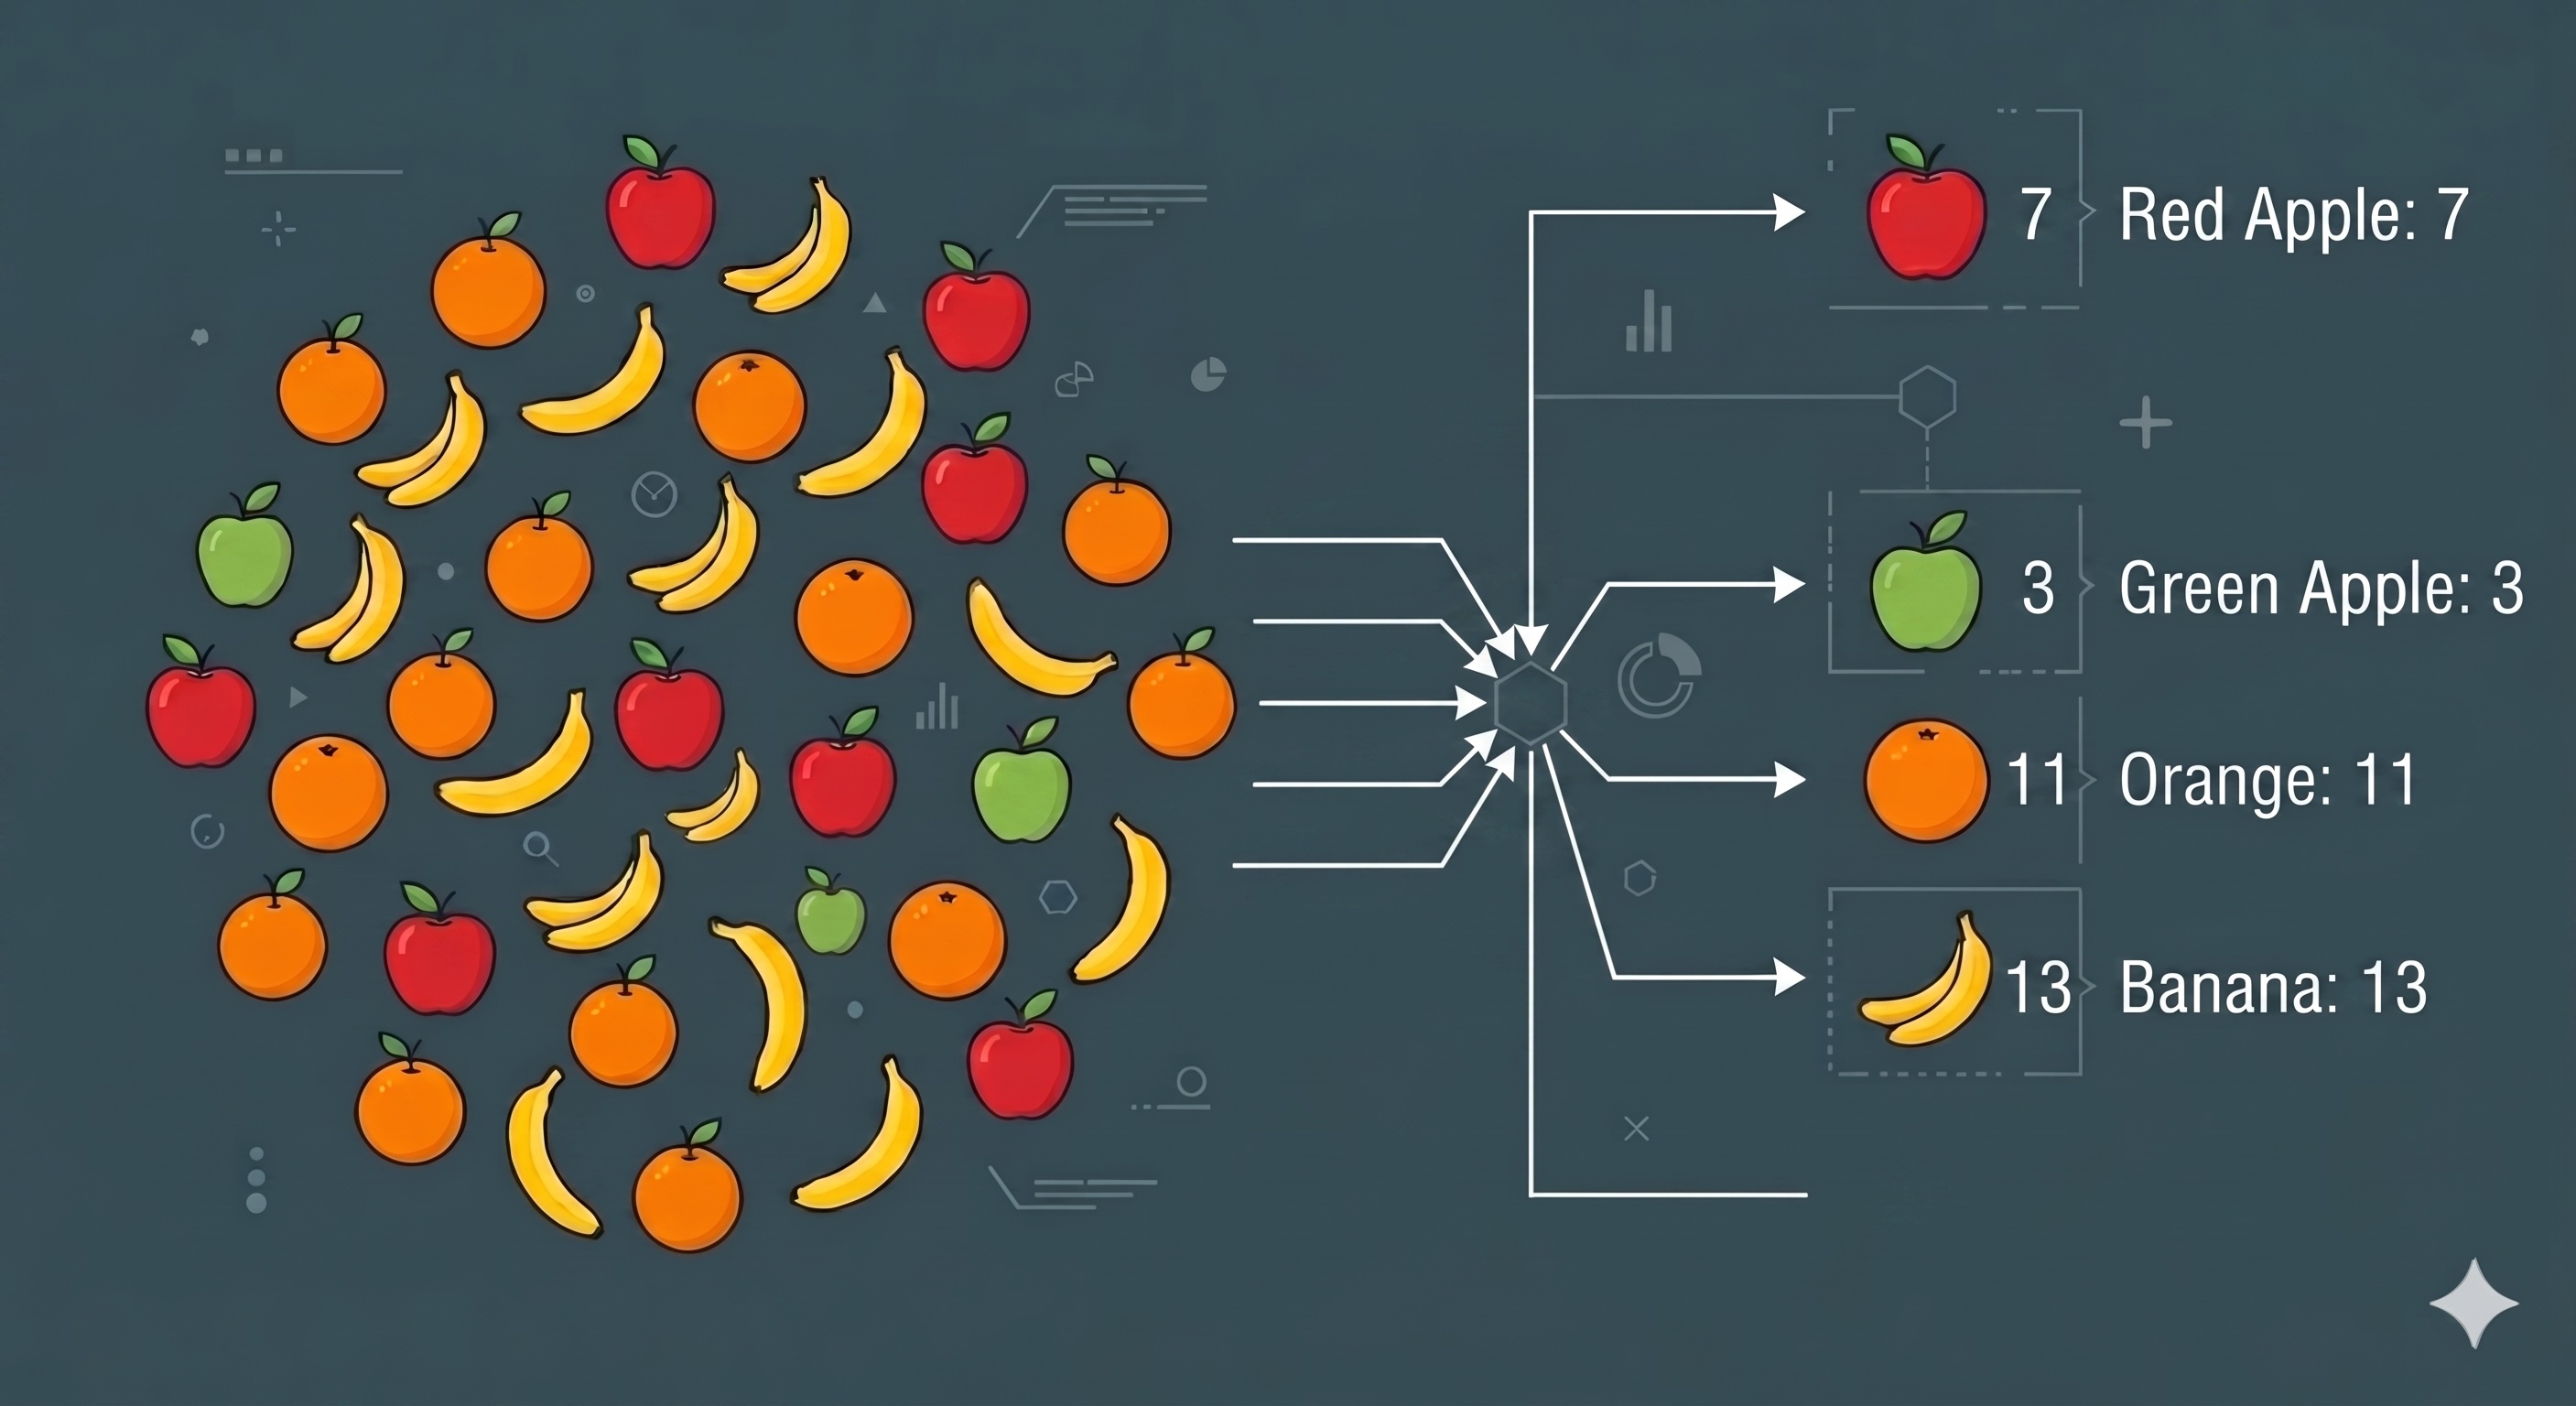
- Data is collected to answer specific questions, such as a teacher taking daily class attendance.
- Unorganised data collected first is called raw data, which is difficult to analyze directly.
- Observations must be recorded in an error-free way to prevent any loss of critical information.
Olympiad Fact
In competitive data handling, always identify the exact parameter being counted (such as the number of students, cars, or items) before performing any calculations.
Organisation of Data
Creating Order from Chaos
Key Points
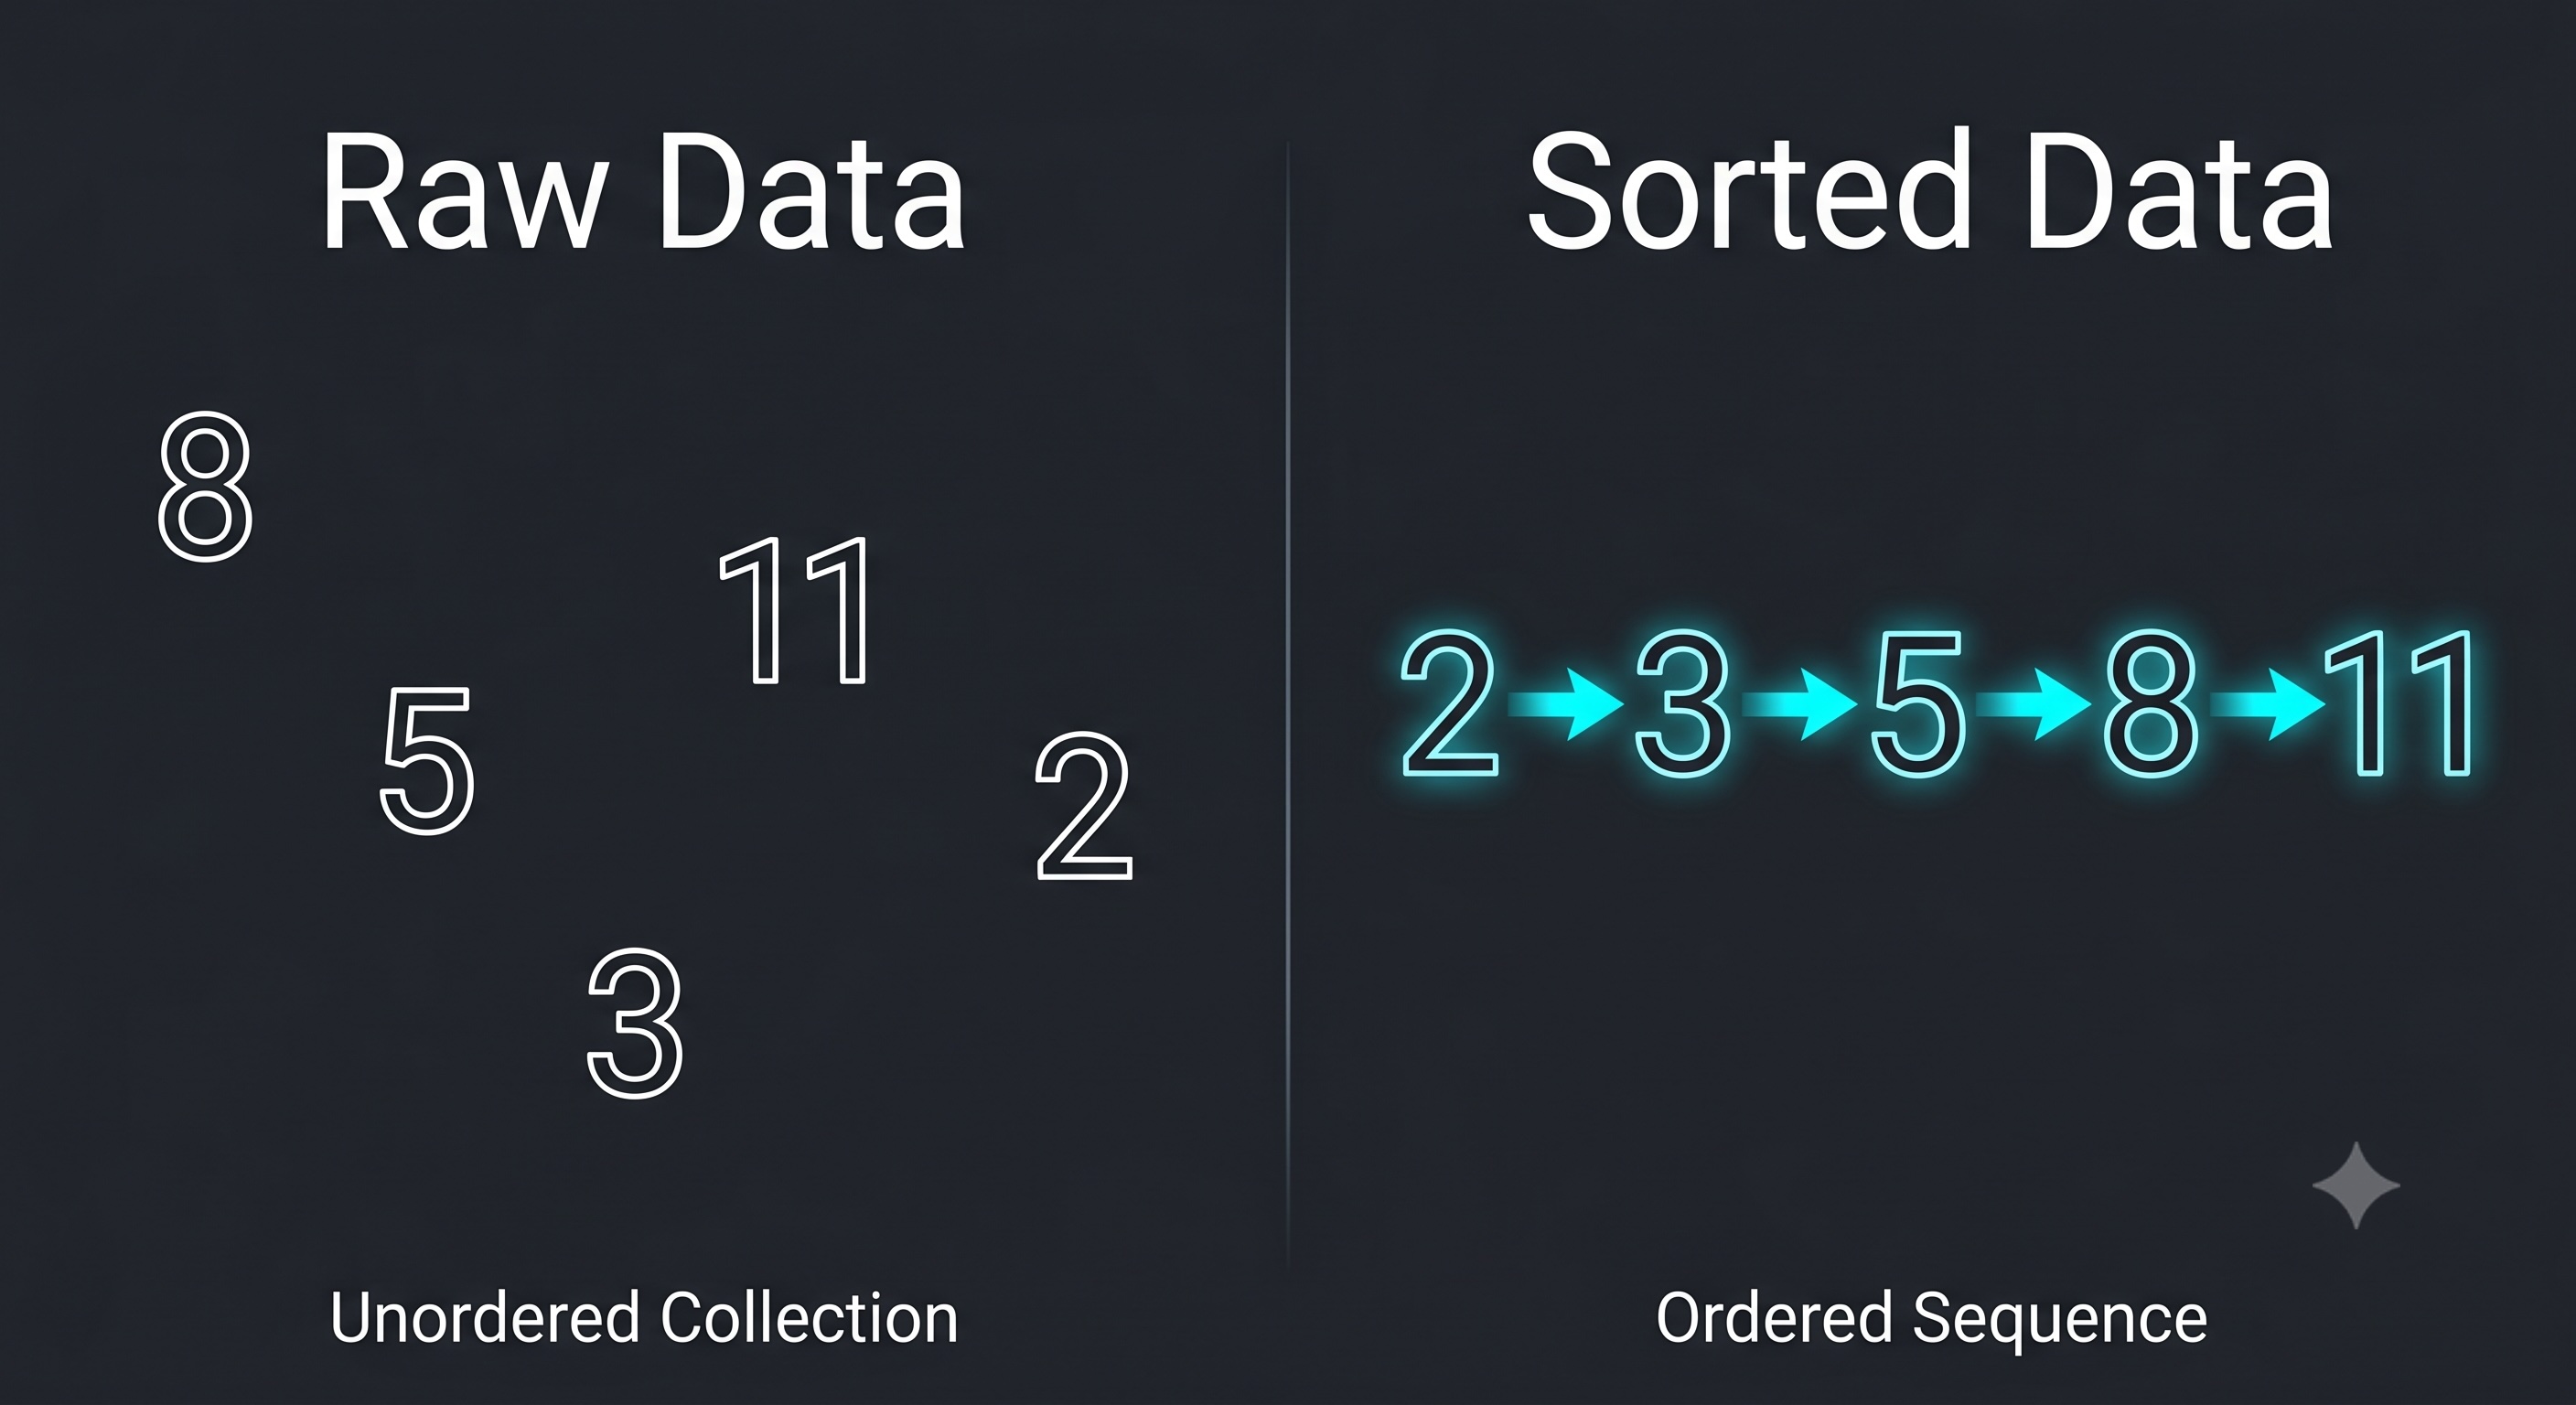
- Data containing names can be arranged in alphabetical order from to .
- Numerical data is organized in ascending order (smallest to largest) or descending order (largest to smallest).
- Organising raw data turns scrambled numbers into structured, readable information.
Olympiad Fact
Sorting numerical values in ascending order is the fastest way to find the minimum value, maximum value, and range of any dataset!
Tally Marks
Systematic Counting in Bunches
Key Points
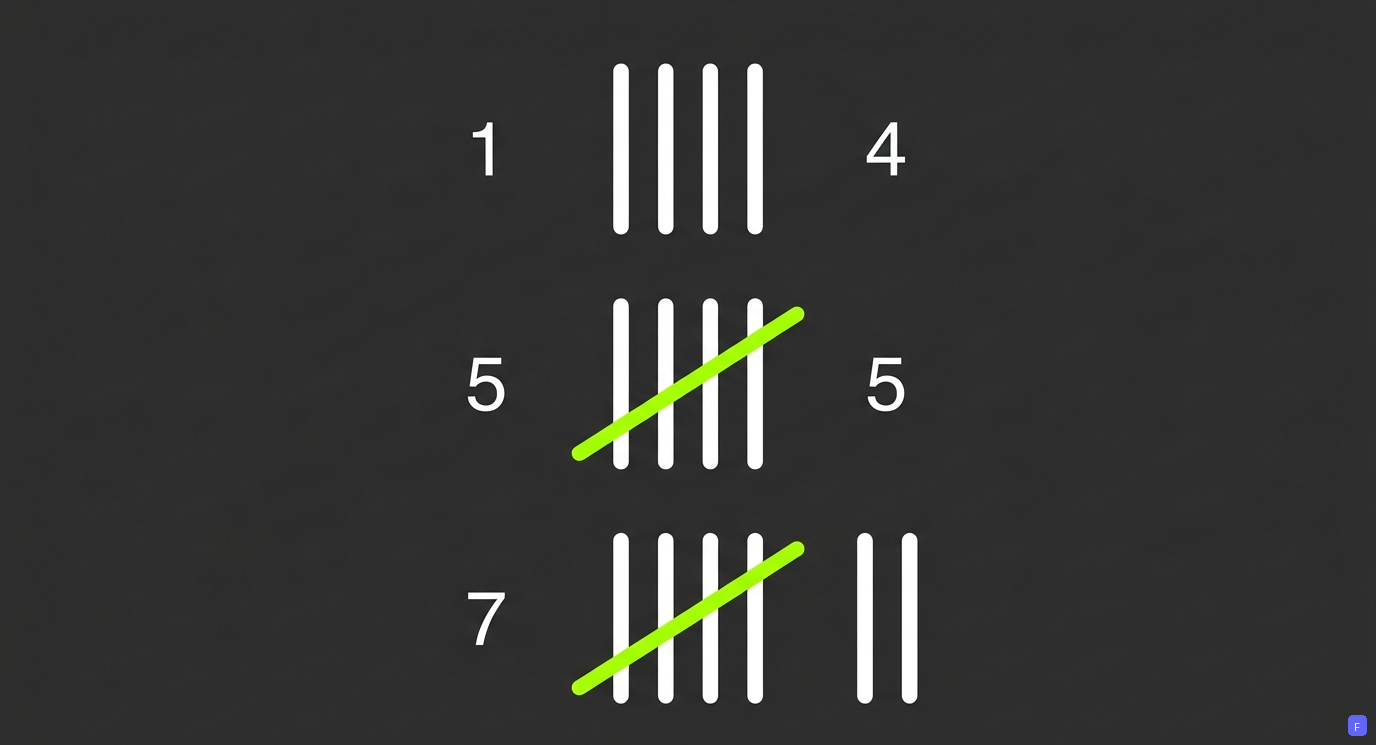
- Each single occurrence of an item is represented by a single vertical stroke ''.
- The fifth occurrence is drawn diagonally across the first four strokes to form a bundle: ''.
- Tallying prevents recount errors when managing extremely large sets of data.
Olympiad Fact
Since tally marks are bundled in groups of , you can quickly calculate frequencies by skip-counting by and then adding the leftover single strokes.
Frequency Distribution
Counting Occurrences Instantly
Key Points
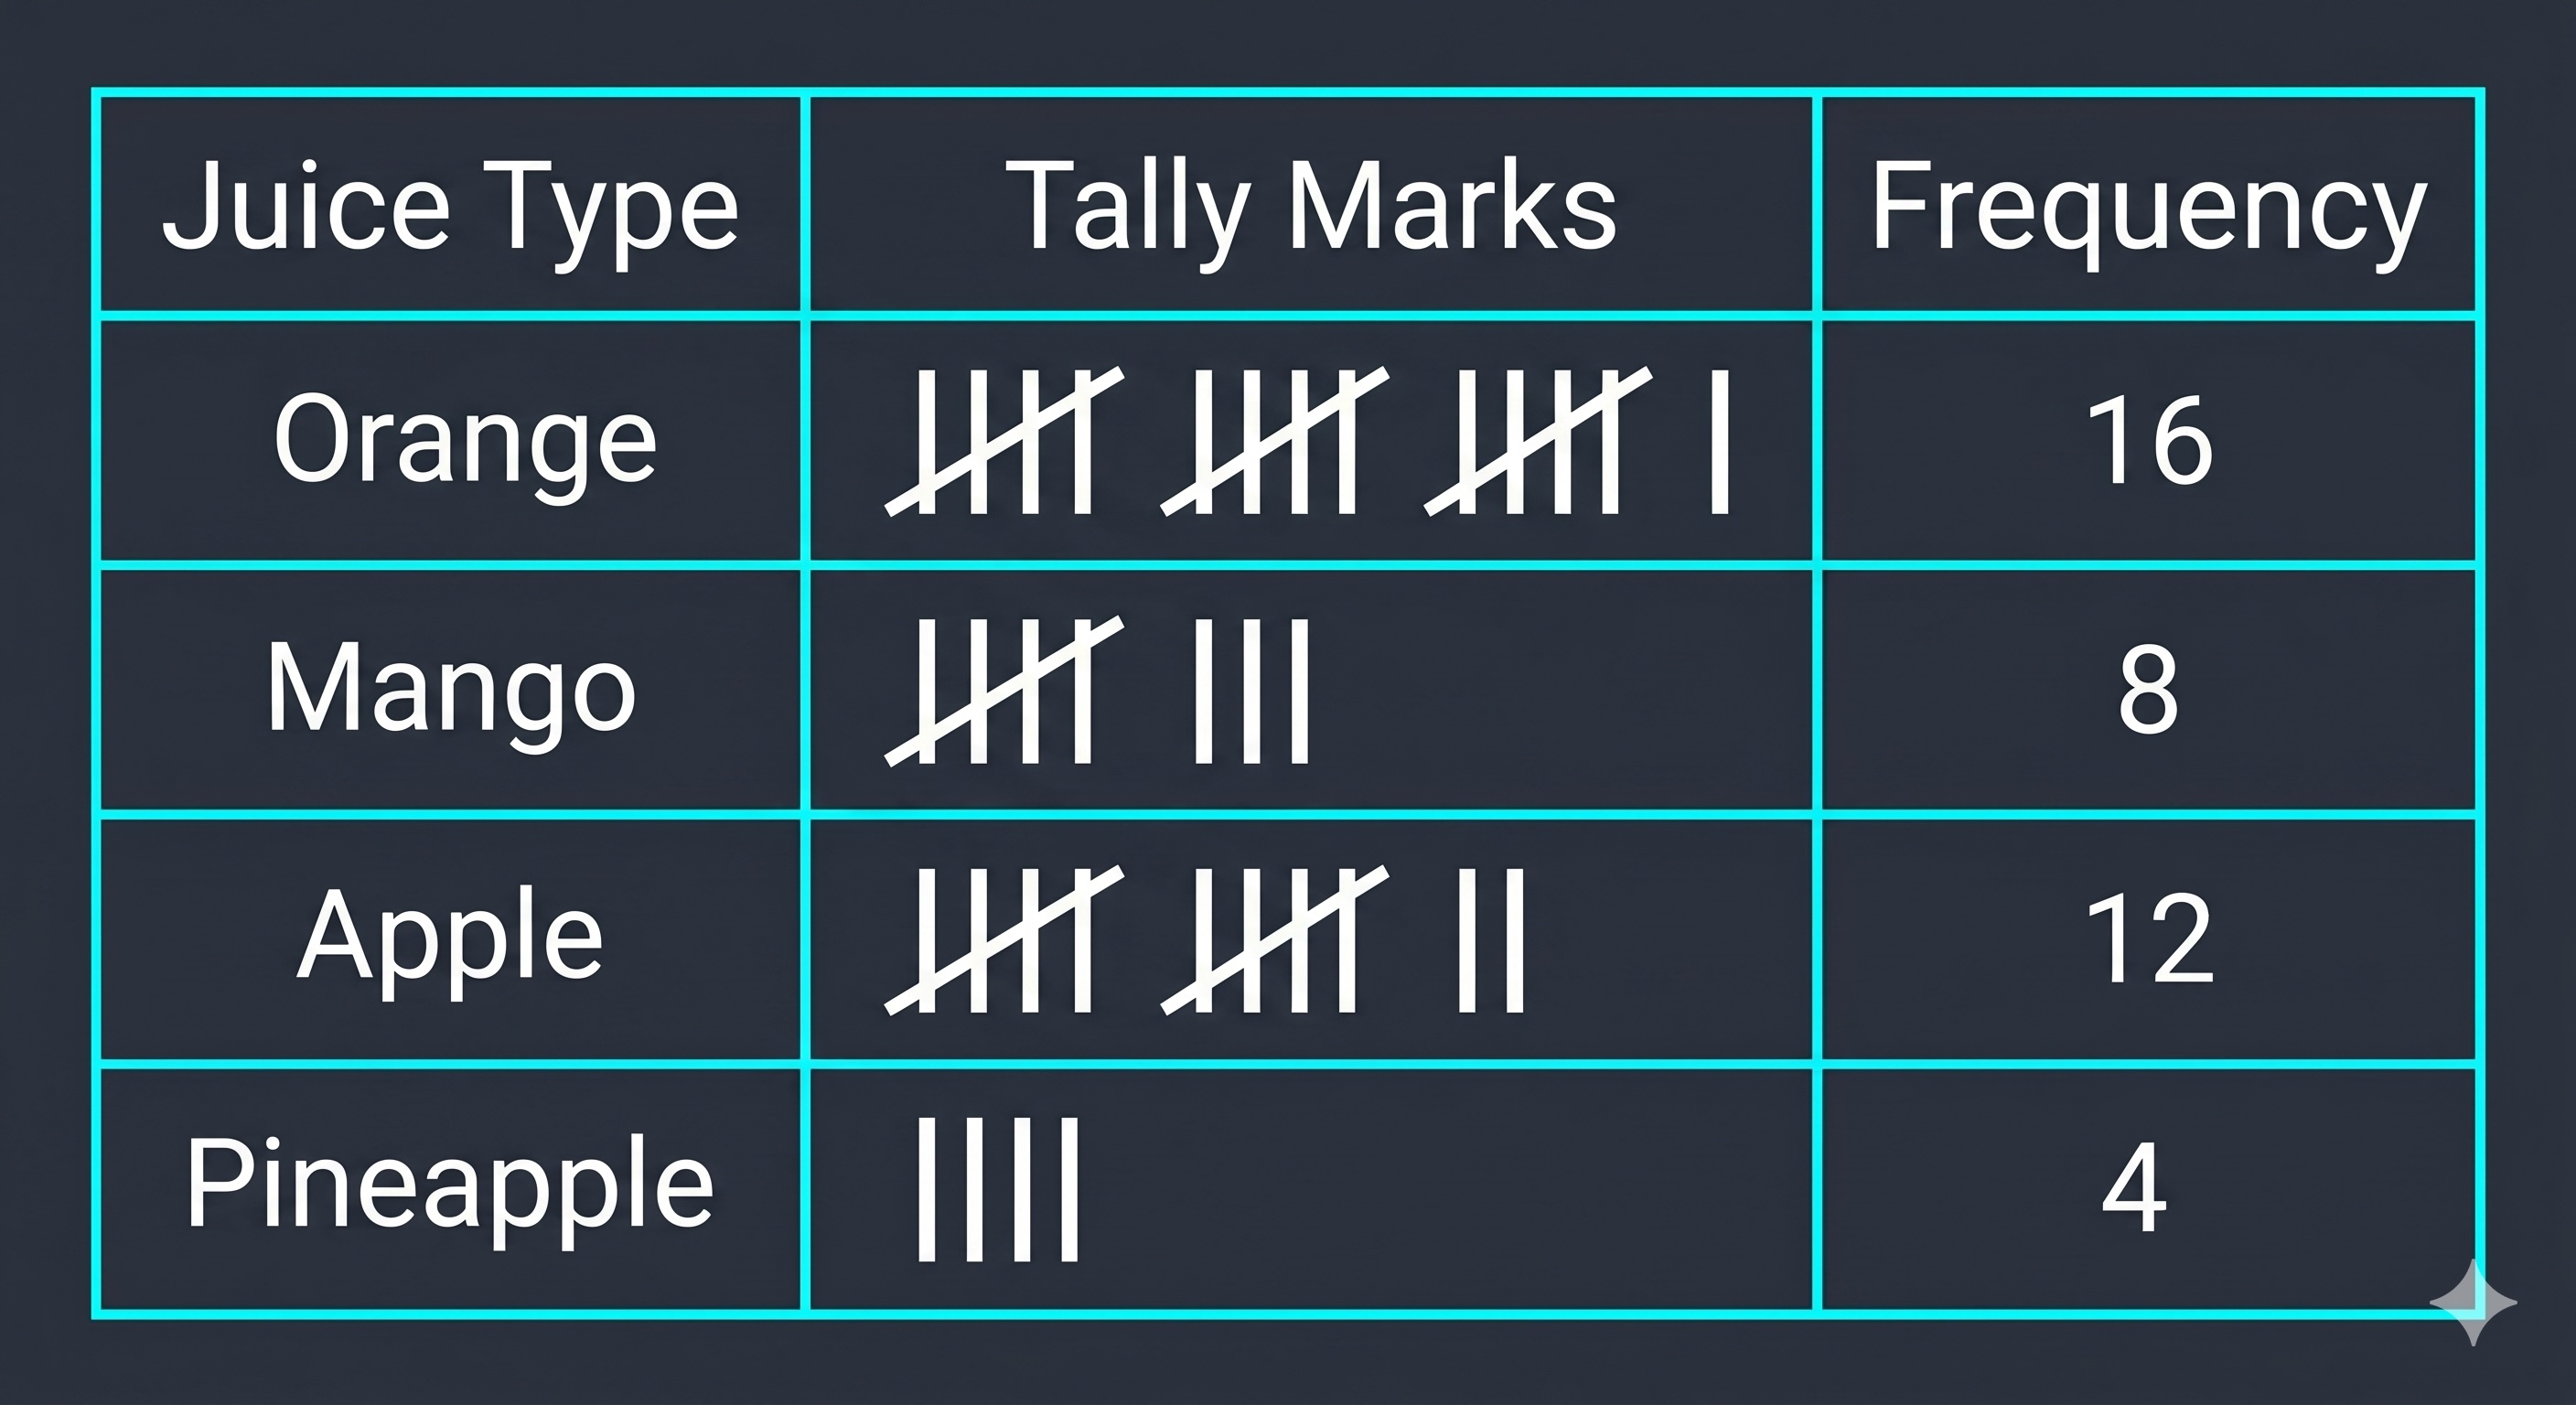
- The frequency column displays the actual numerical counts of the tally bunches.
- The sum of all frequencies in a table must equal the total number of initial observations.
- Frequency tables present large datasets compactly, preventing the need to read long scrambled lists.
Olympiad Fact
A frequency table is the foundational layout for all advanced charts; always verify that your total frequency matches the count of raw data points!