
Data Infographics
Concept of Infographics
Enhancing Data Visuals
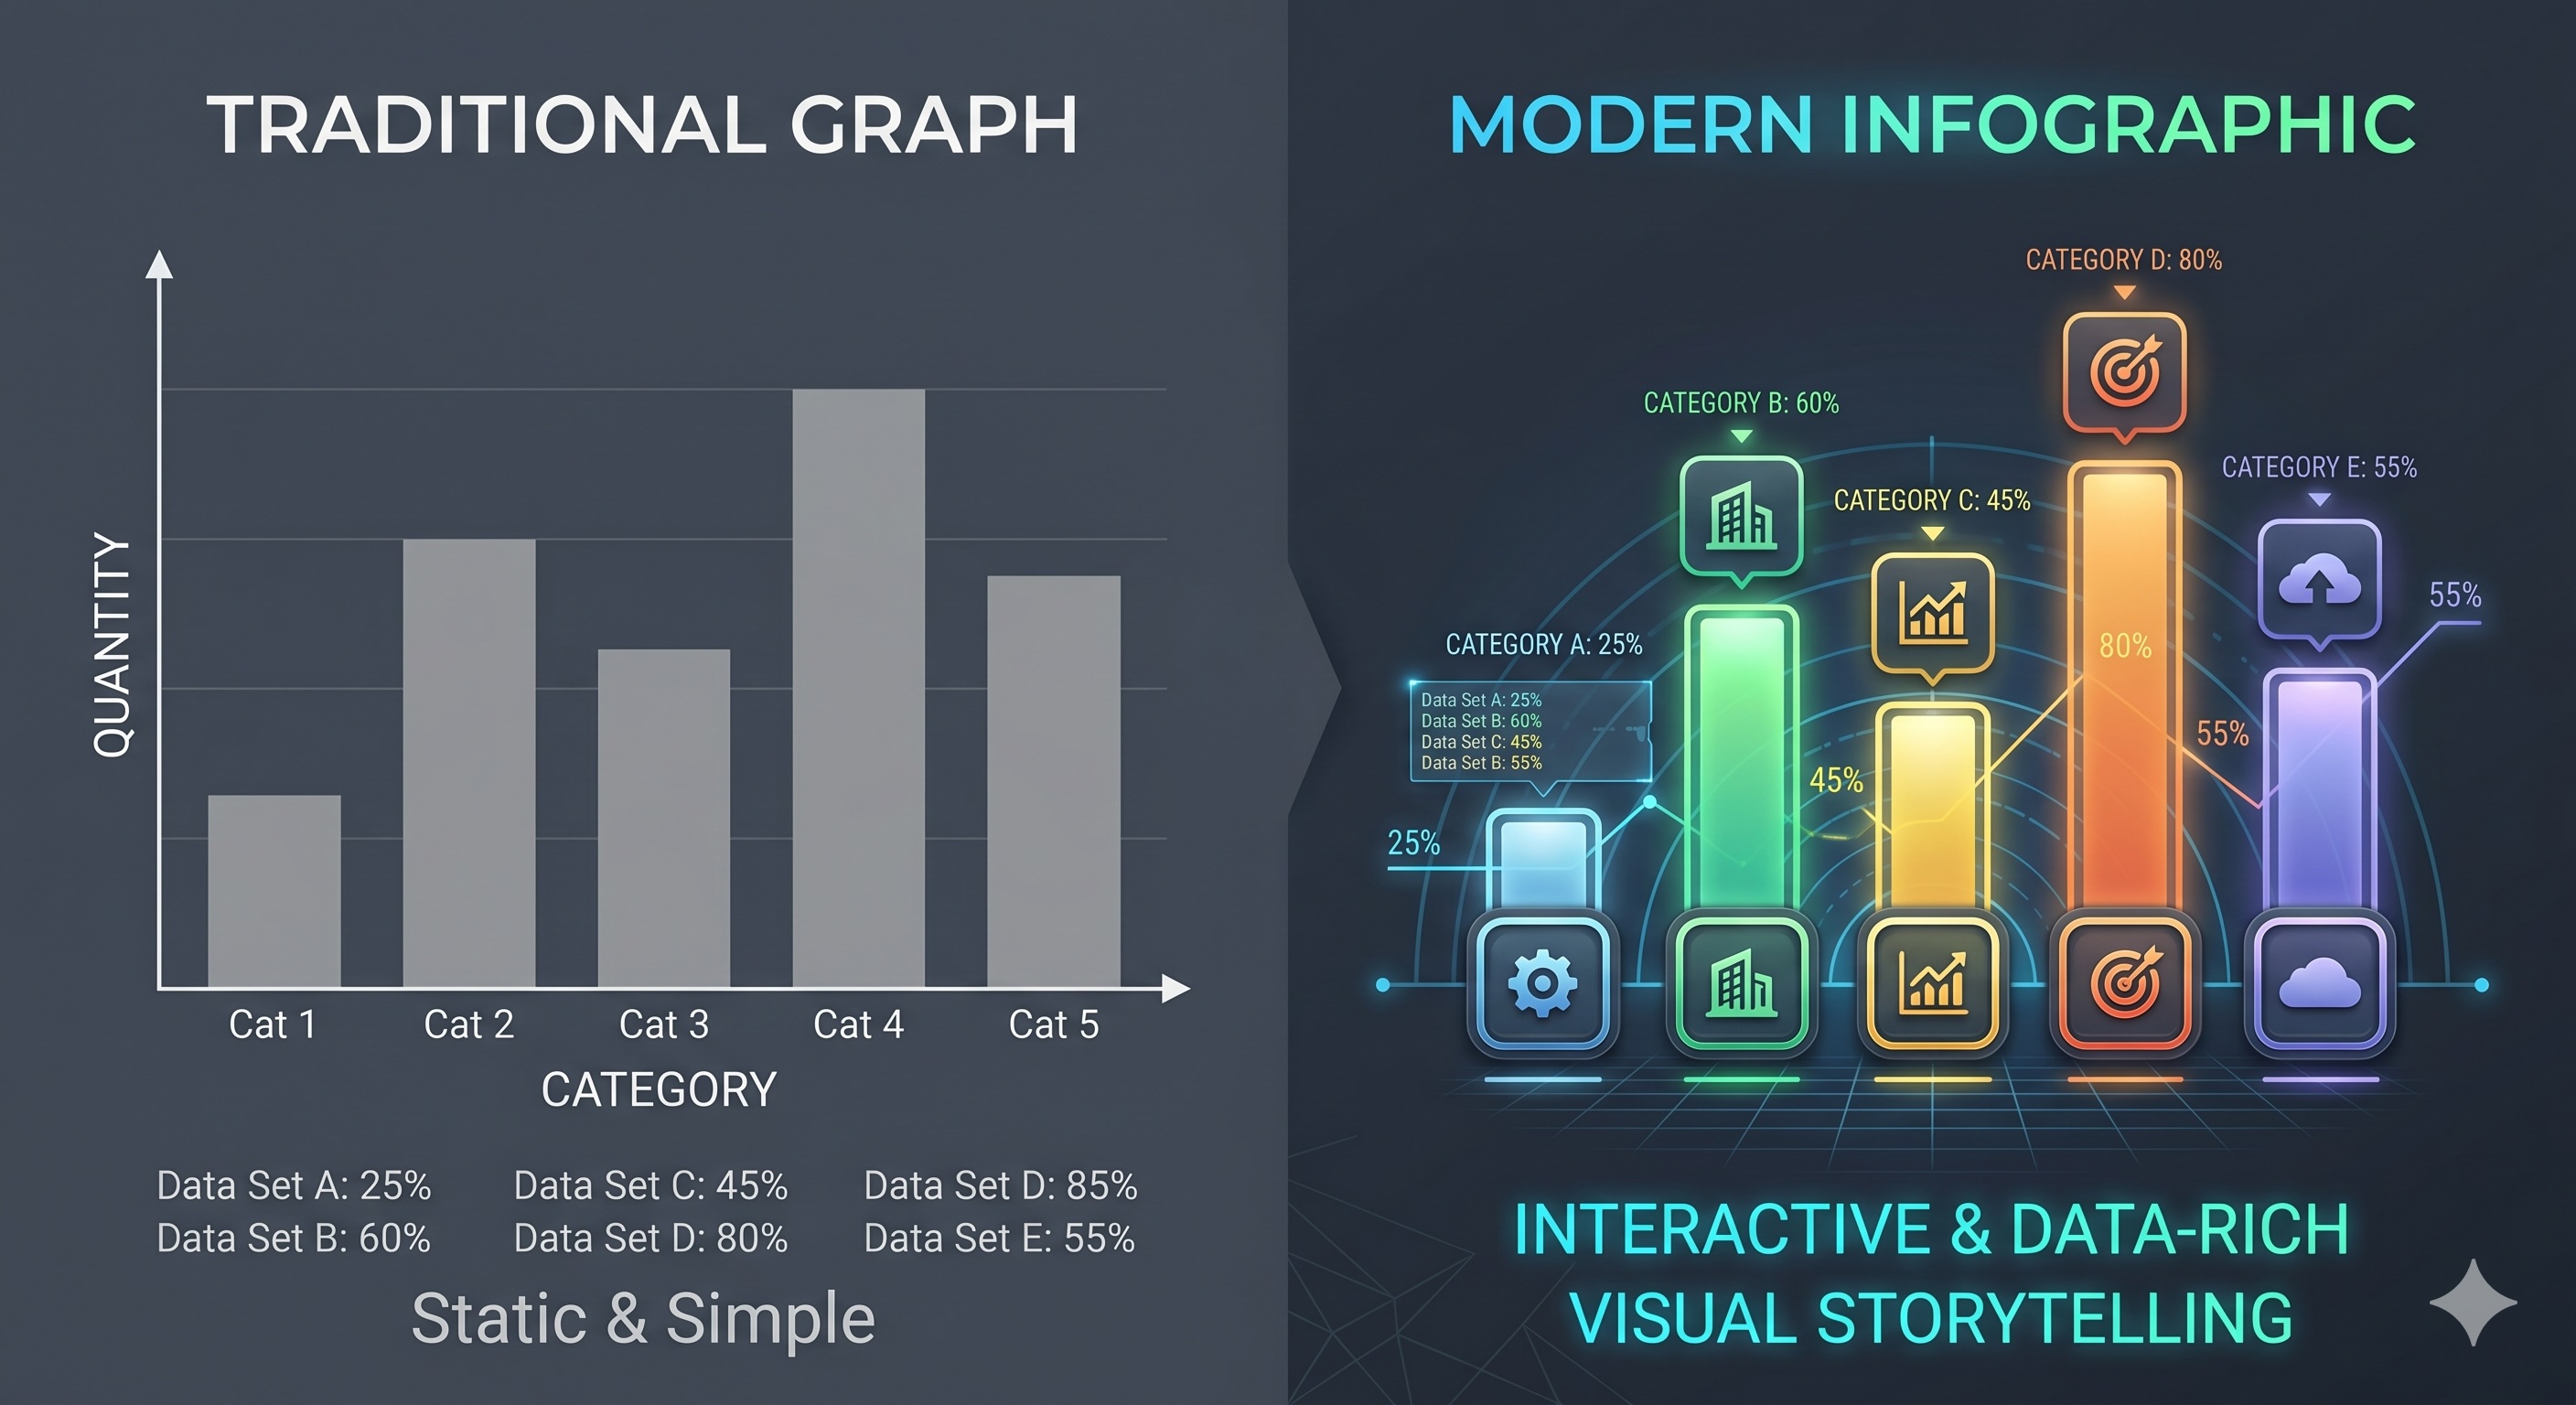
Infographics enhance traditional data presentations, like bar graphs, by combining artistic and visual design elements. This makes information more attractive, clear, and faster to communicate.
Key Points
- Infographics combine data with relevant thematic art to tell a visual story.
- They help viewers grasp complex relationships and comparisons almost instantly.
- Transforms dry, plain numerical tables into engaging and effective visual presentations.
Olympiad Fact
Infographics are heavily utilized in modern scientific reports and competitive exams because they improve human data comprehension by over compared to plain text!
Custom Data Shapes
Contextual Representation
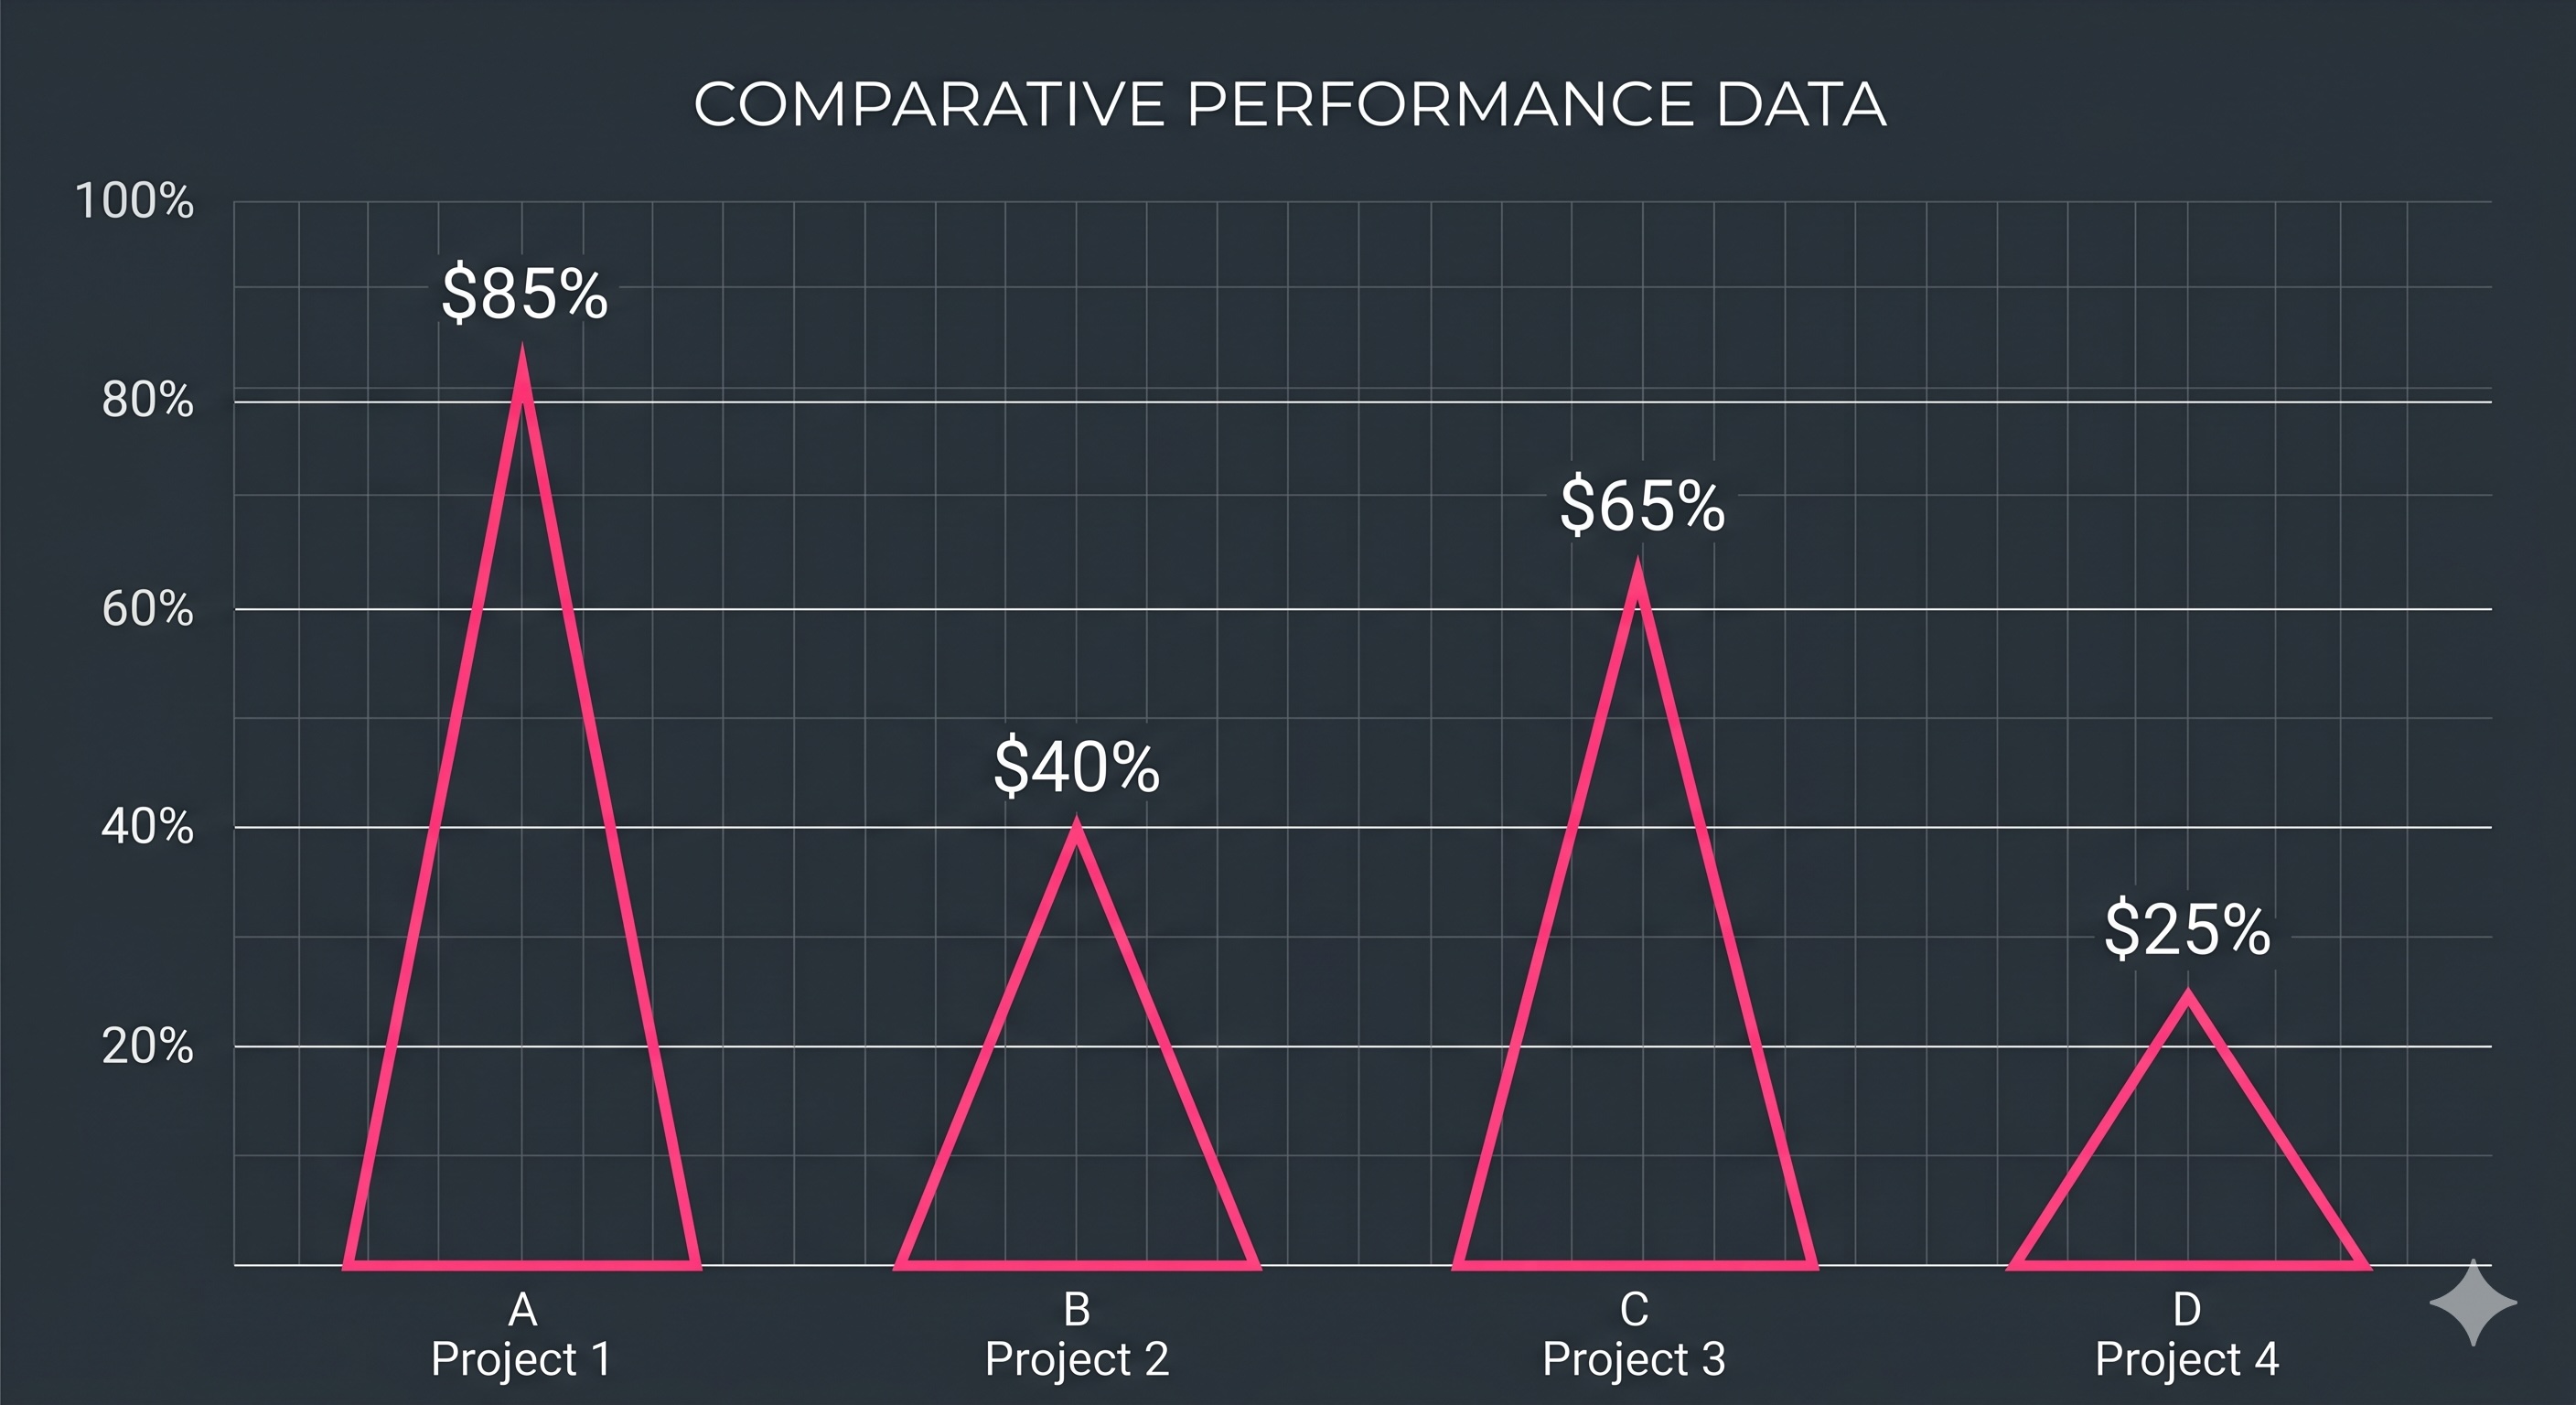
Instead of drawing plain rectangular bars, infographics use custom shapes that better represent the actual data being measured, such as triangles or icons.
Key Points
- Vertical bars can be represented by clean, upward-pointing triangular shapes.
- Using representative shapes makes a graph highly intuitive and visually connected to the topic.
- Helps prevent visual boredom while maintaining mathematical accuracy of the values.
Olympiad Fact
Even when using custom shapes like triangles, the height of the shape must match the numerical scale exactly to keep the data representation mathematically accurate!
Contextual Background Design
Visual Storytelling
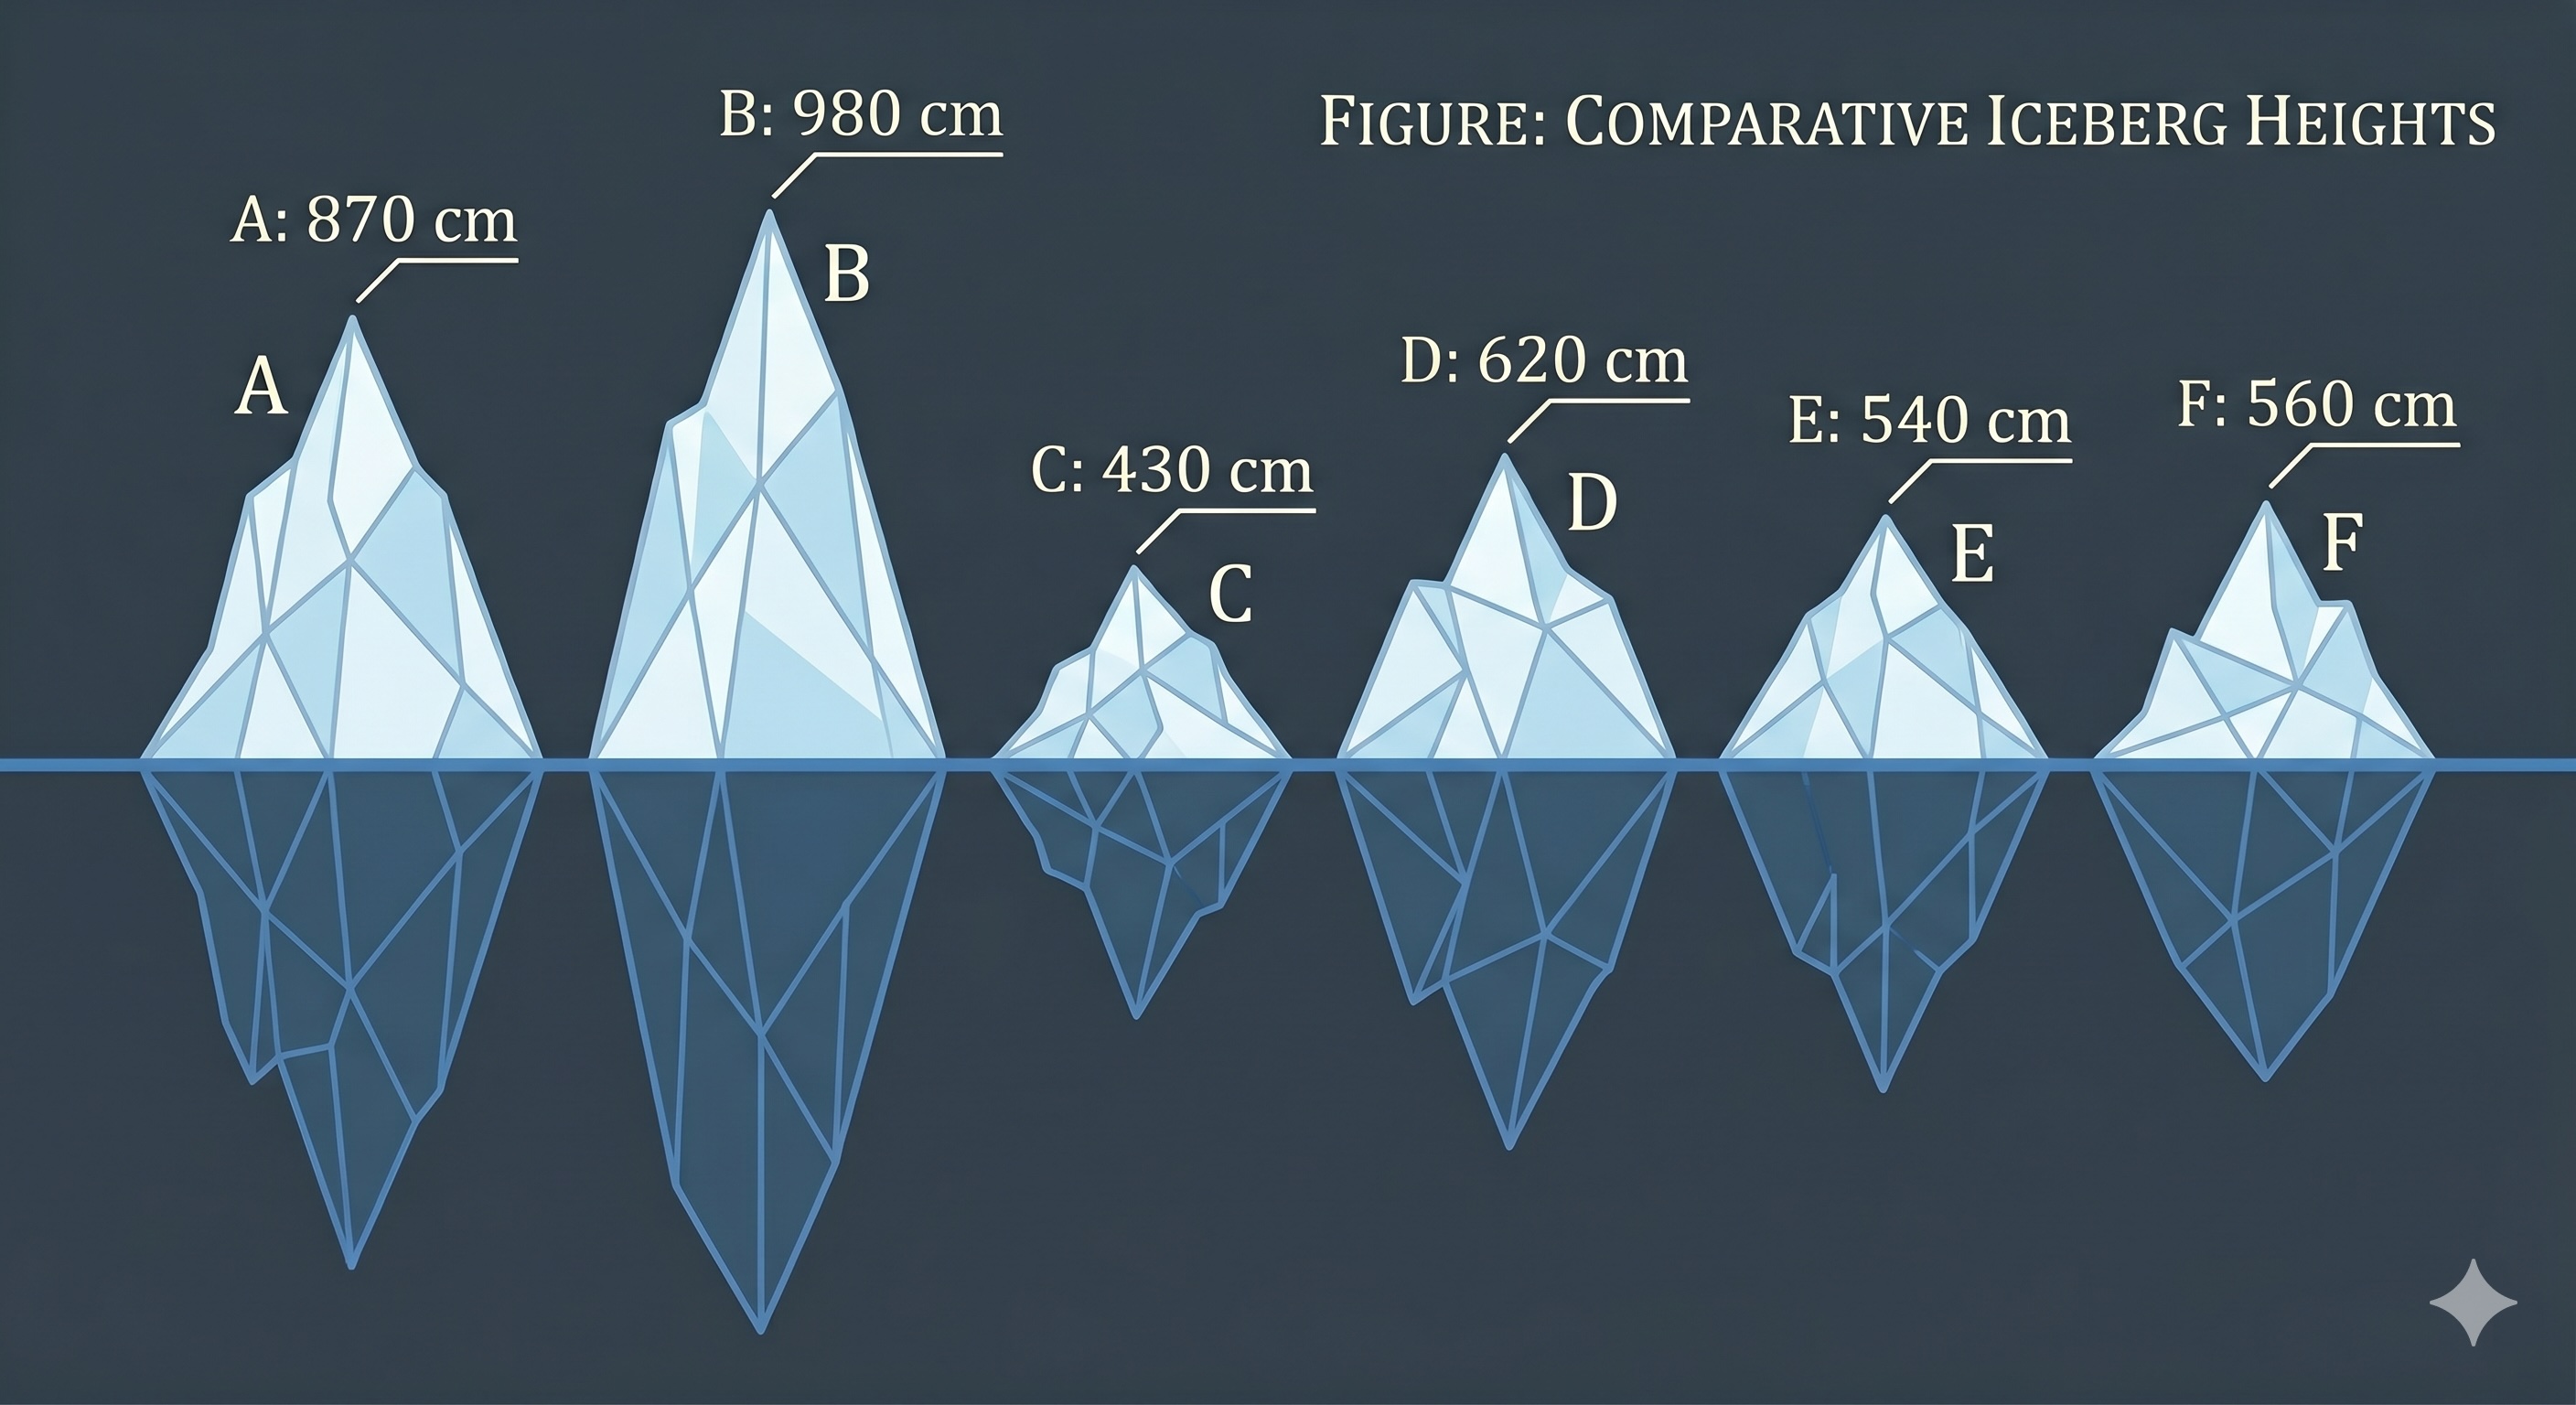
Adding realistic thematic background elements, such as mountain peaks or floating icebergs, provides instant real-world context to the data being presented.
Key Points
- We can represent height data in extremely cold climates by drawing the actual profiles of floating icebergs.
- The ambient temperature (such as a freezing over-sea temperature of ) provides immediate real-world context.
- Drawings can represent both the visible part above the water line and the submerged part below the water line.
Olympiad Fact
For maximum clarity, always read the precise numeric labels printed next to the infographic icons (e.g., '' or '' for icebergs) to ensure exact measurements are used.
Swipe to skip‹