
Bar Graphs
The Bar Graph
Rectangular Data Columns
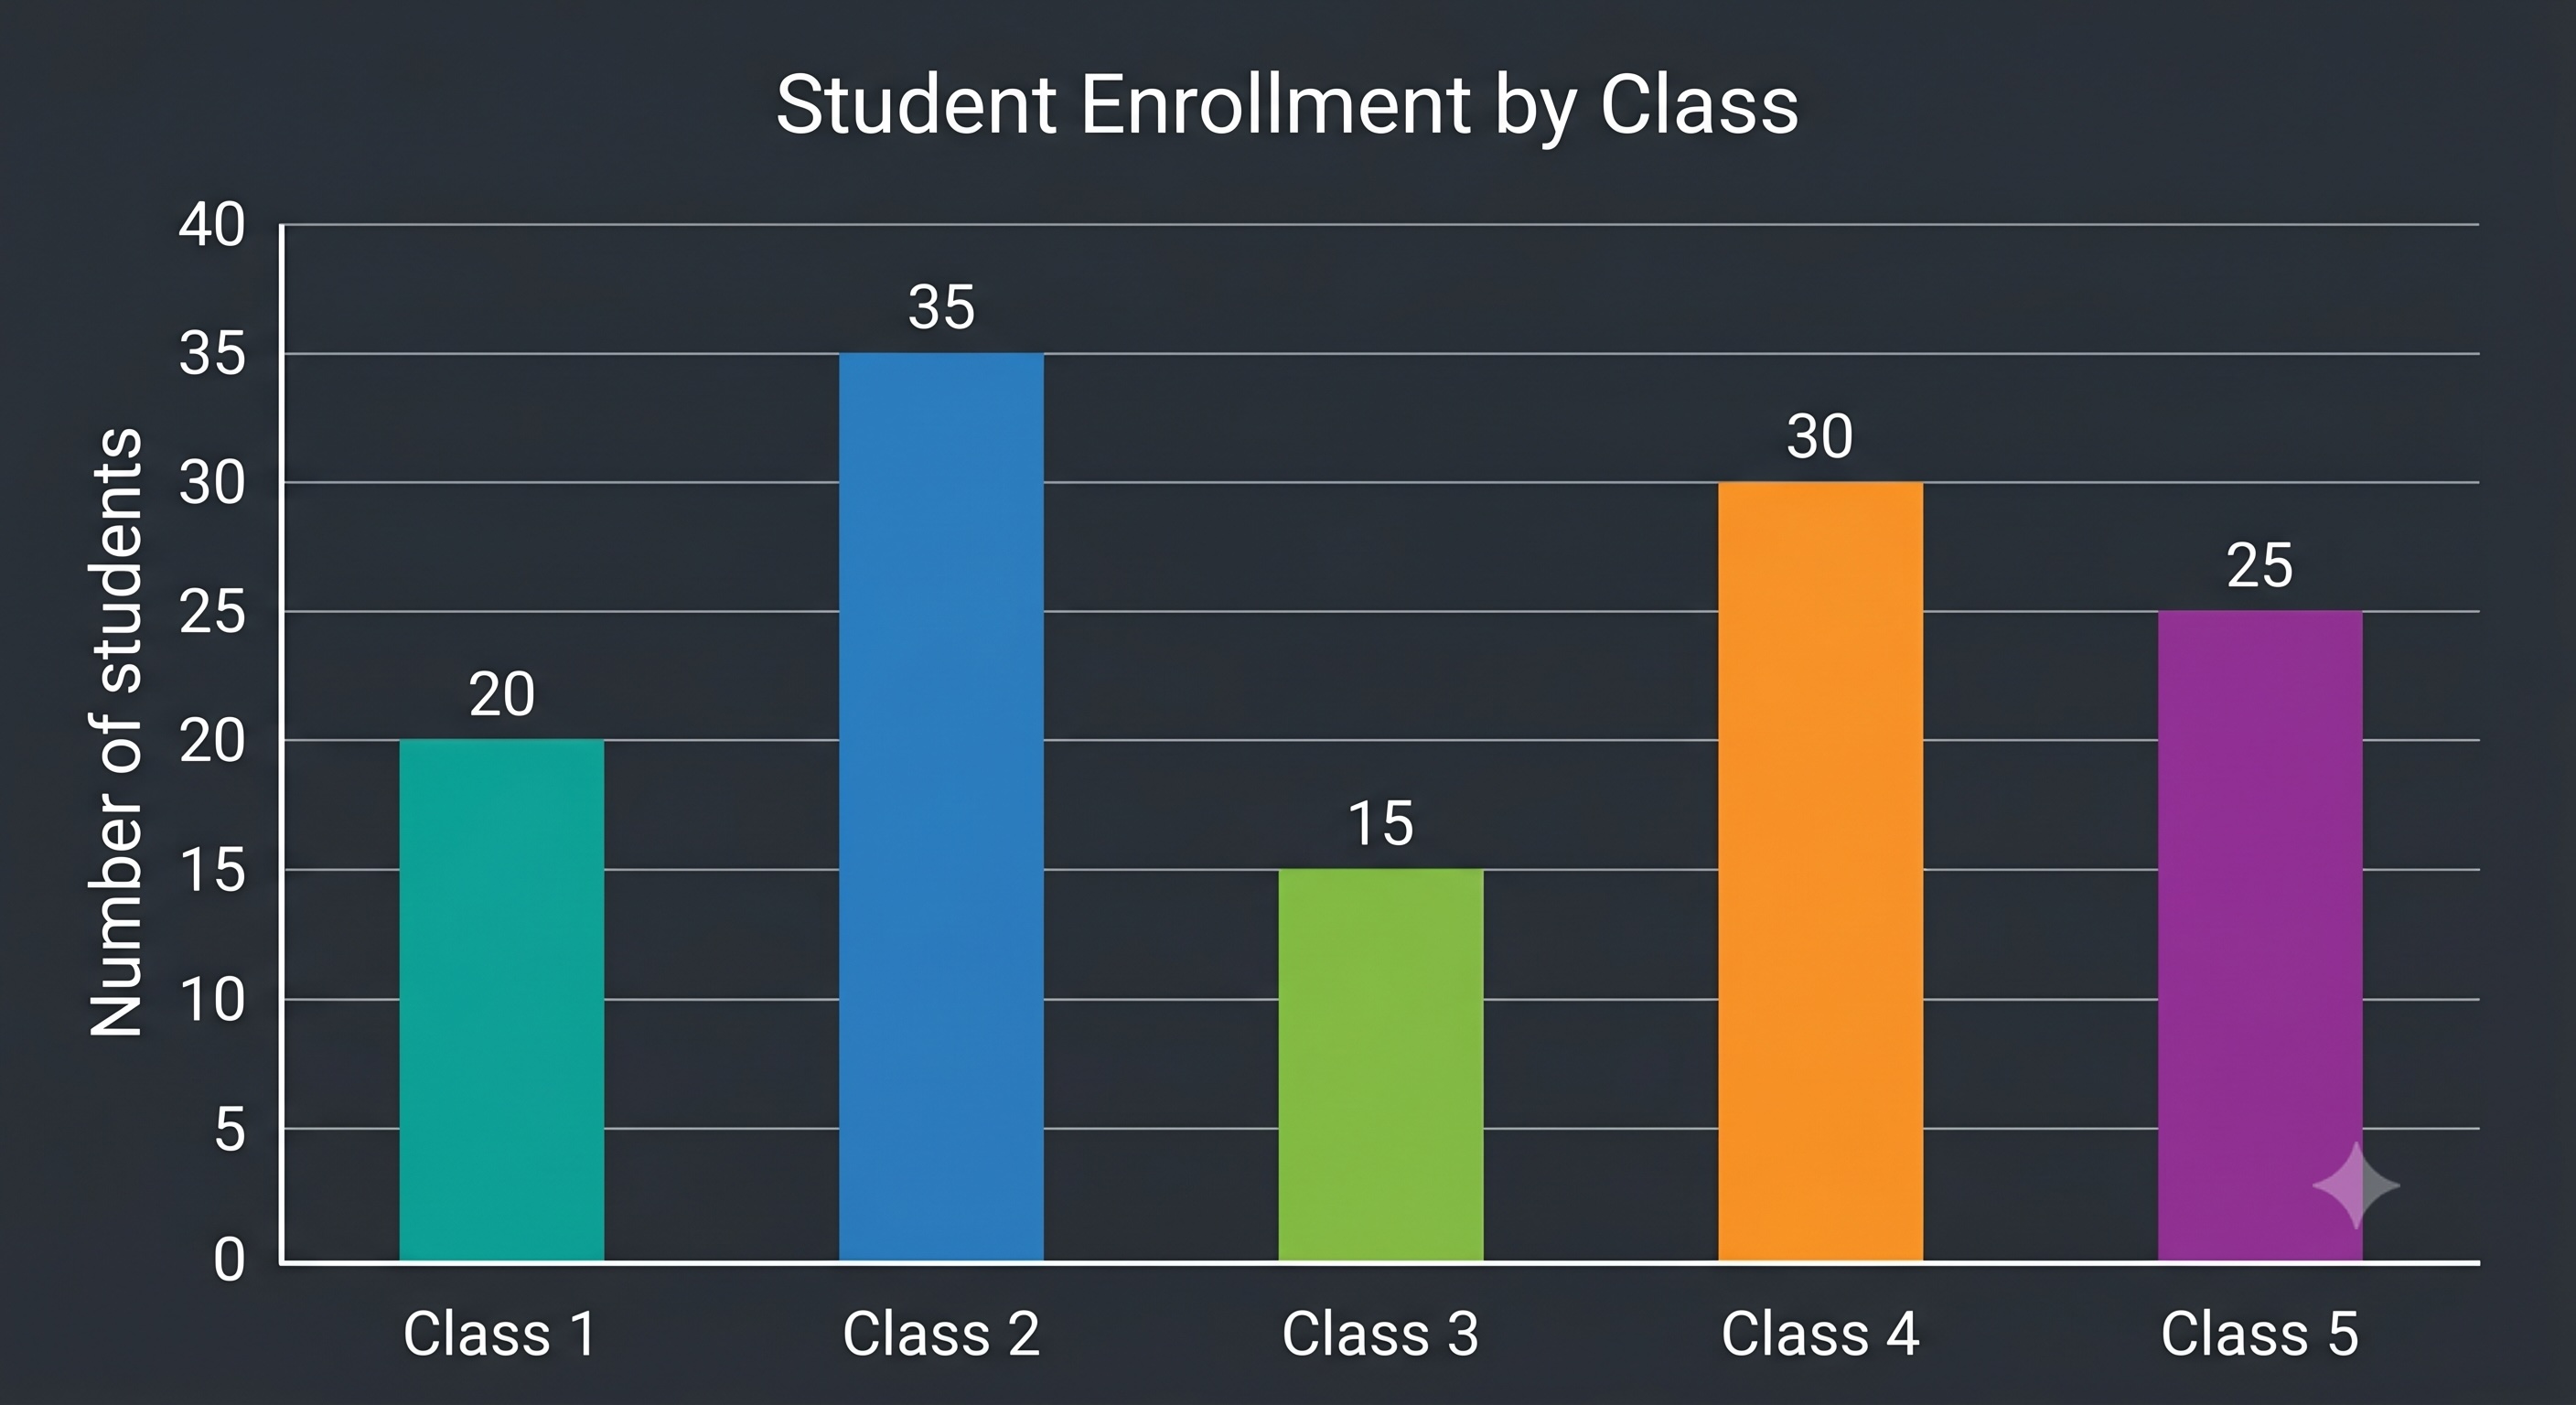
A bar graph is a pictorial representation of data using vertical or horizontal rectangular bars. The height or length of each bar is proportional to the frequency of the category it represents.
Key Points
- Used to visually compare different categories of data, frequencies, or measurements.
- Bars can be drawn vertically (rising upwards) or horizontally (extending to the right).
- Highly effective for tracking changes and identifying trends over time.
Olympiad Fact
In bar graphs, the vertical height represents the absolute frequency; therefore, a bar that is twice as tall as another represents exactly double the value.
Elements: Bars and Axes
The Grid Boundaries
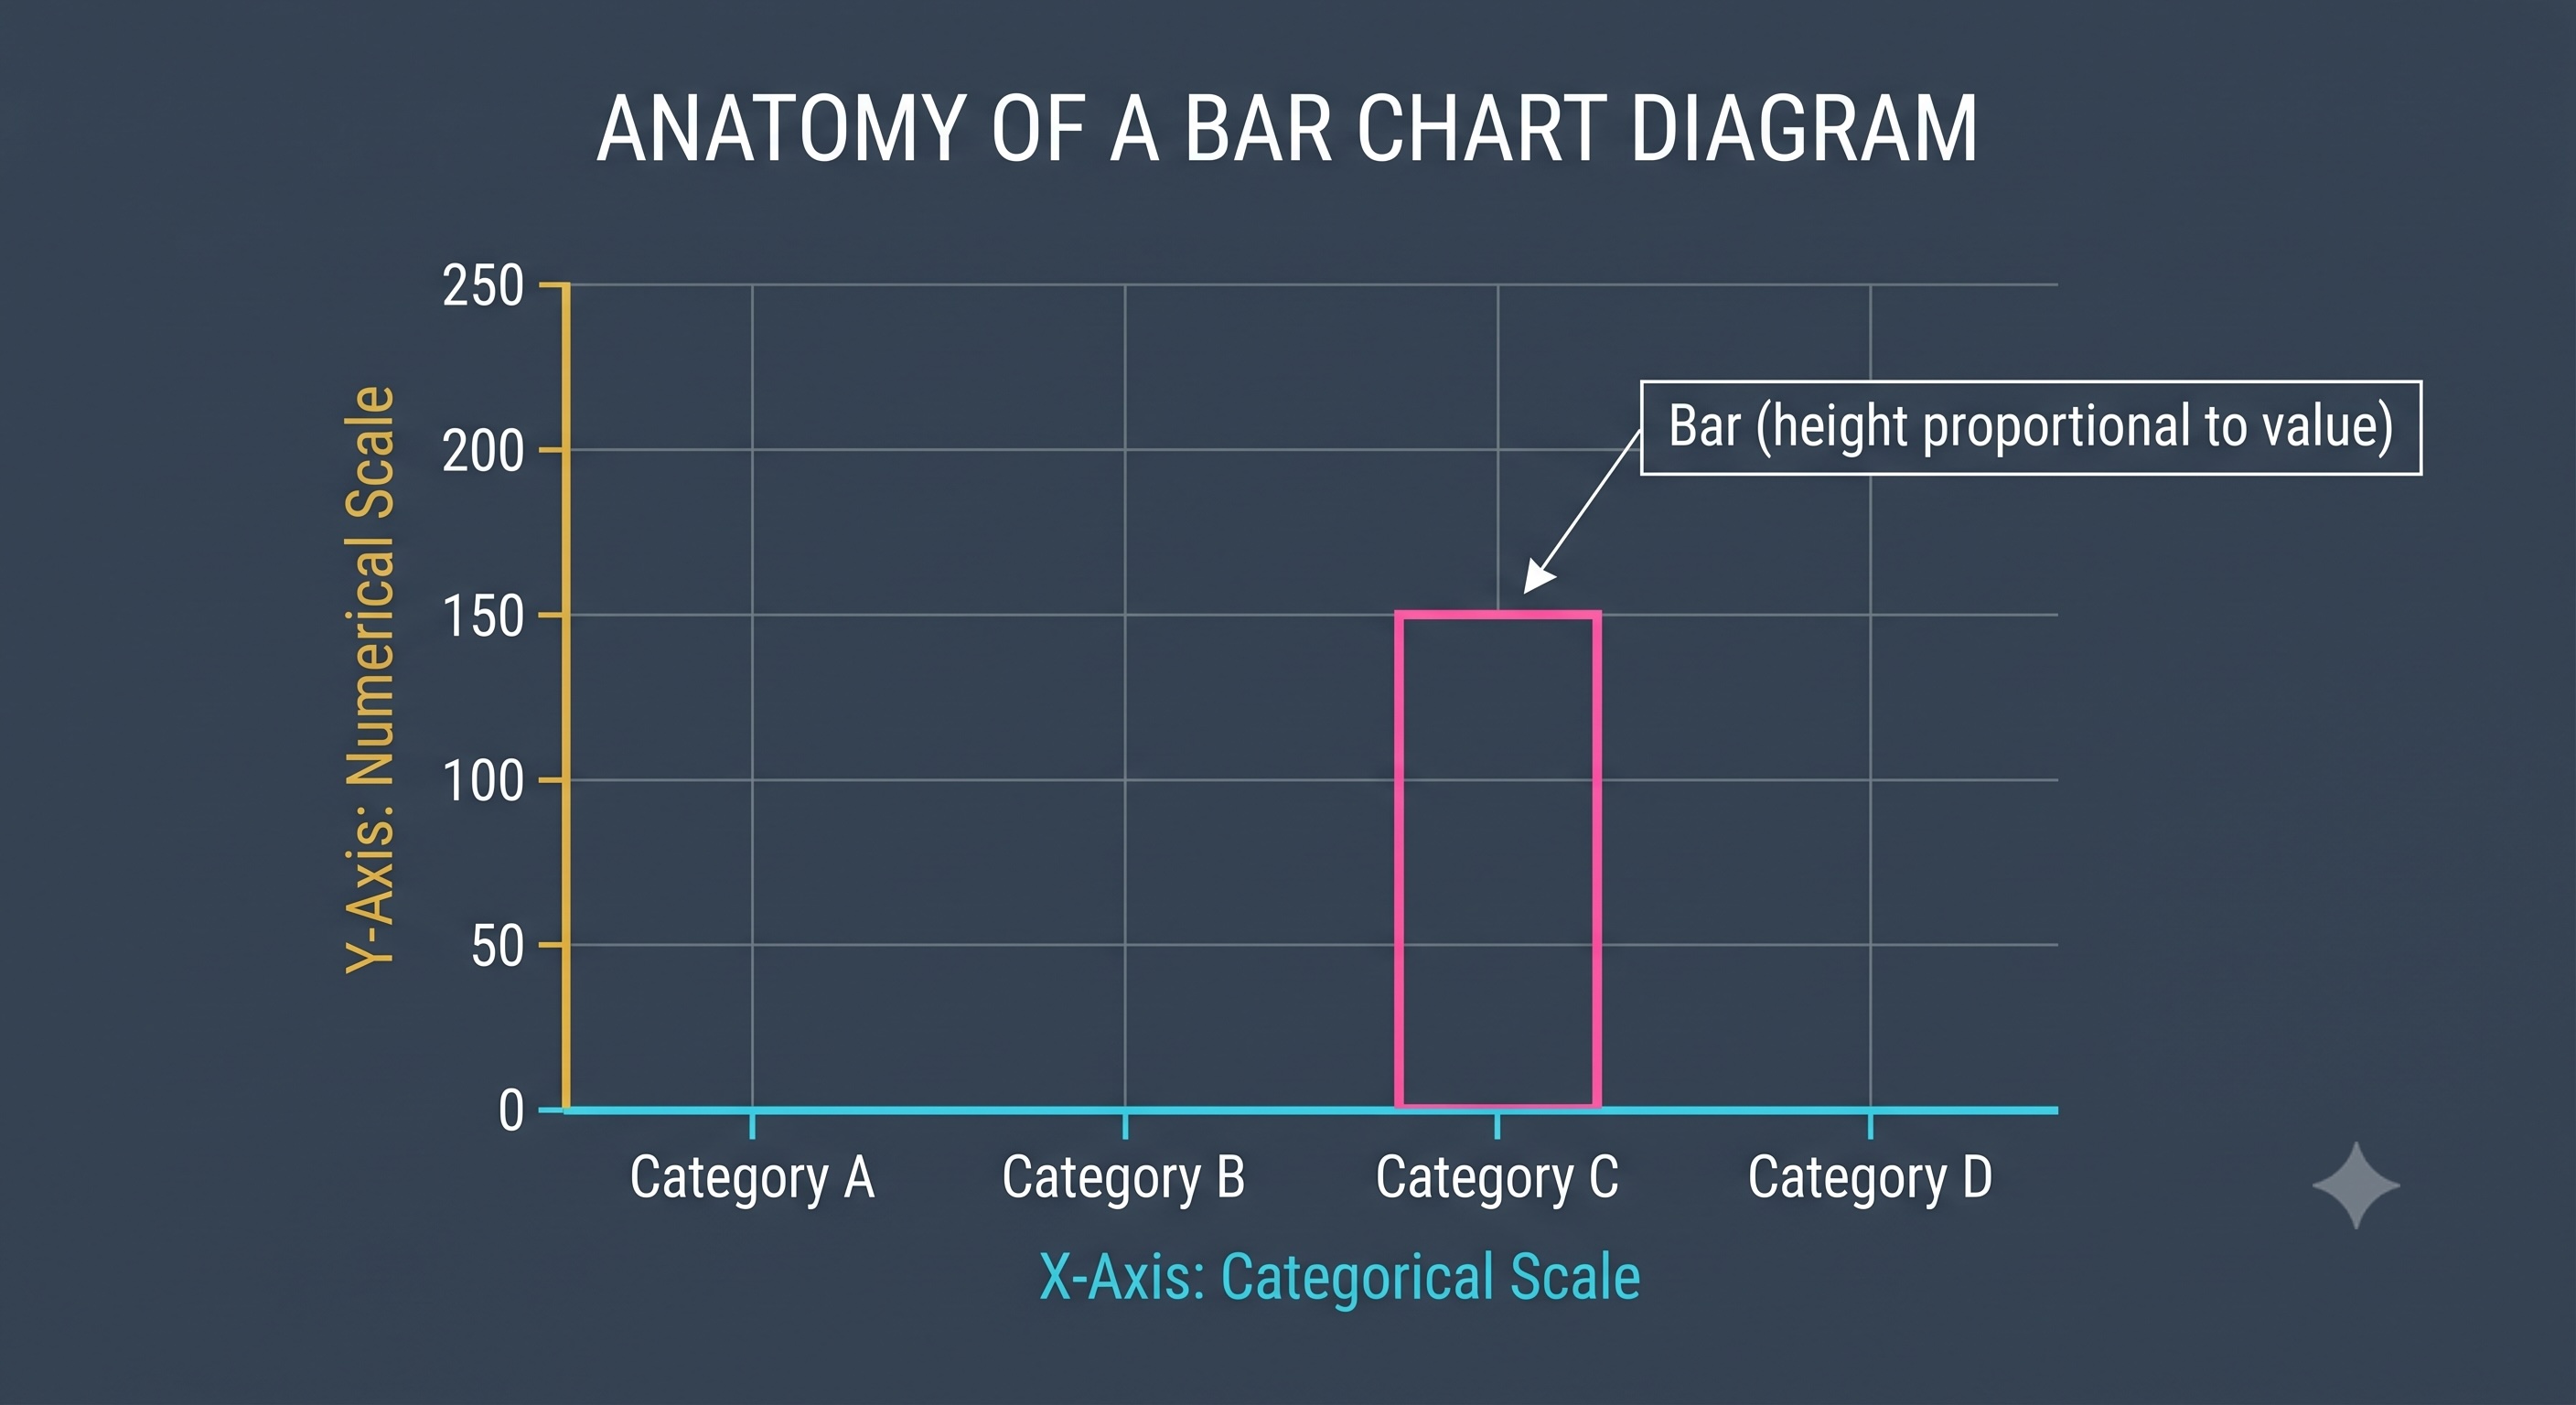
A bar graph is built on two primary structural components: the rectangular bars and the perpendicular axes (X-axis and Y-axis) that define the grid boundaries.
Key Points
- The perpendicular lines on which data is plotted are called the 'axes'.
- One axis represents categorical data (non-numerical categories like classes or days).
- The other perpendicular axis represents the numerical scale (frequencies or values).
Olympiad Fact
The intersection point of both axes is called the origin, which always represents a coordinate value of .
Structural Properties
Rules of Proper Drafting
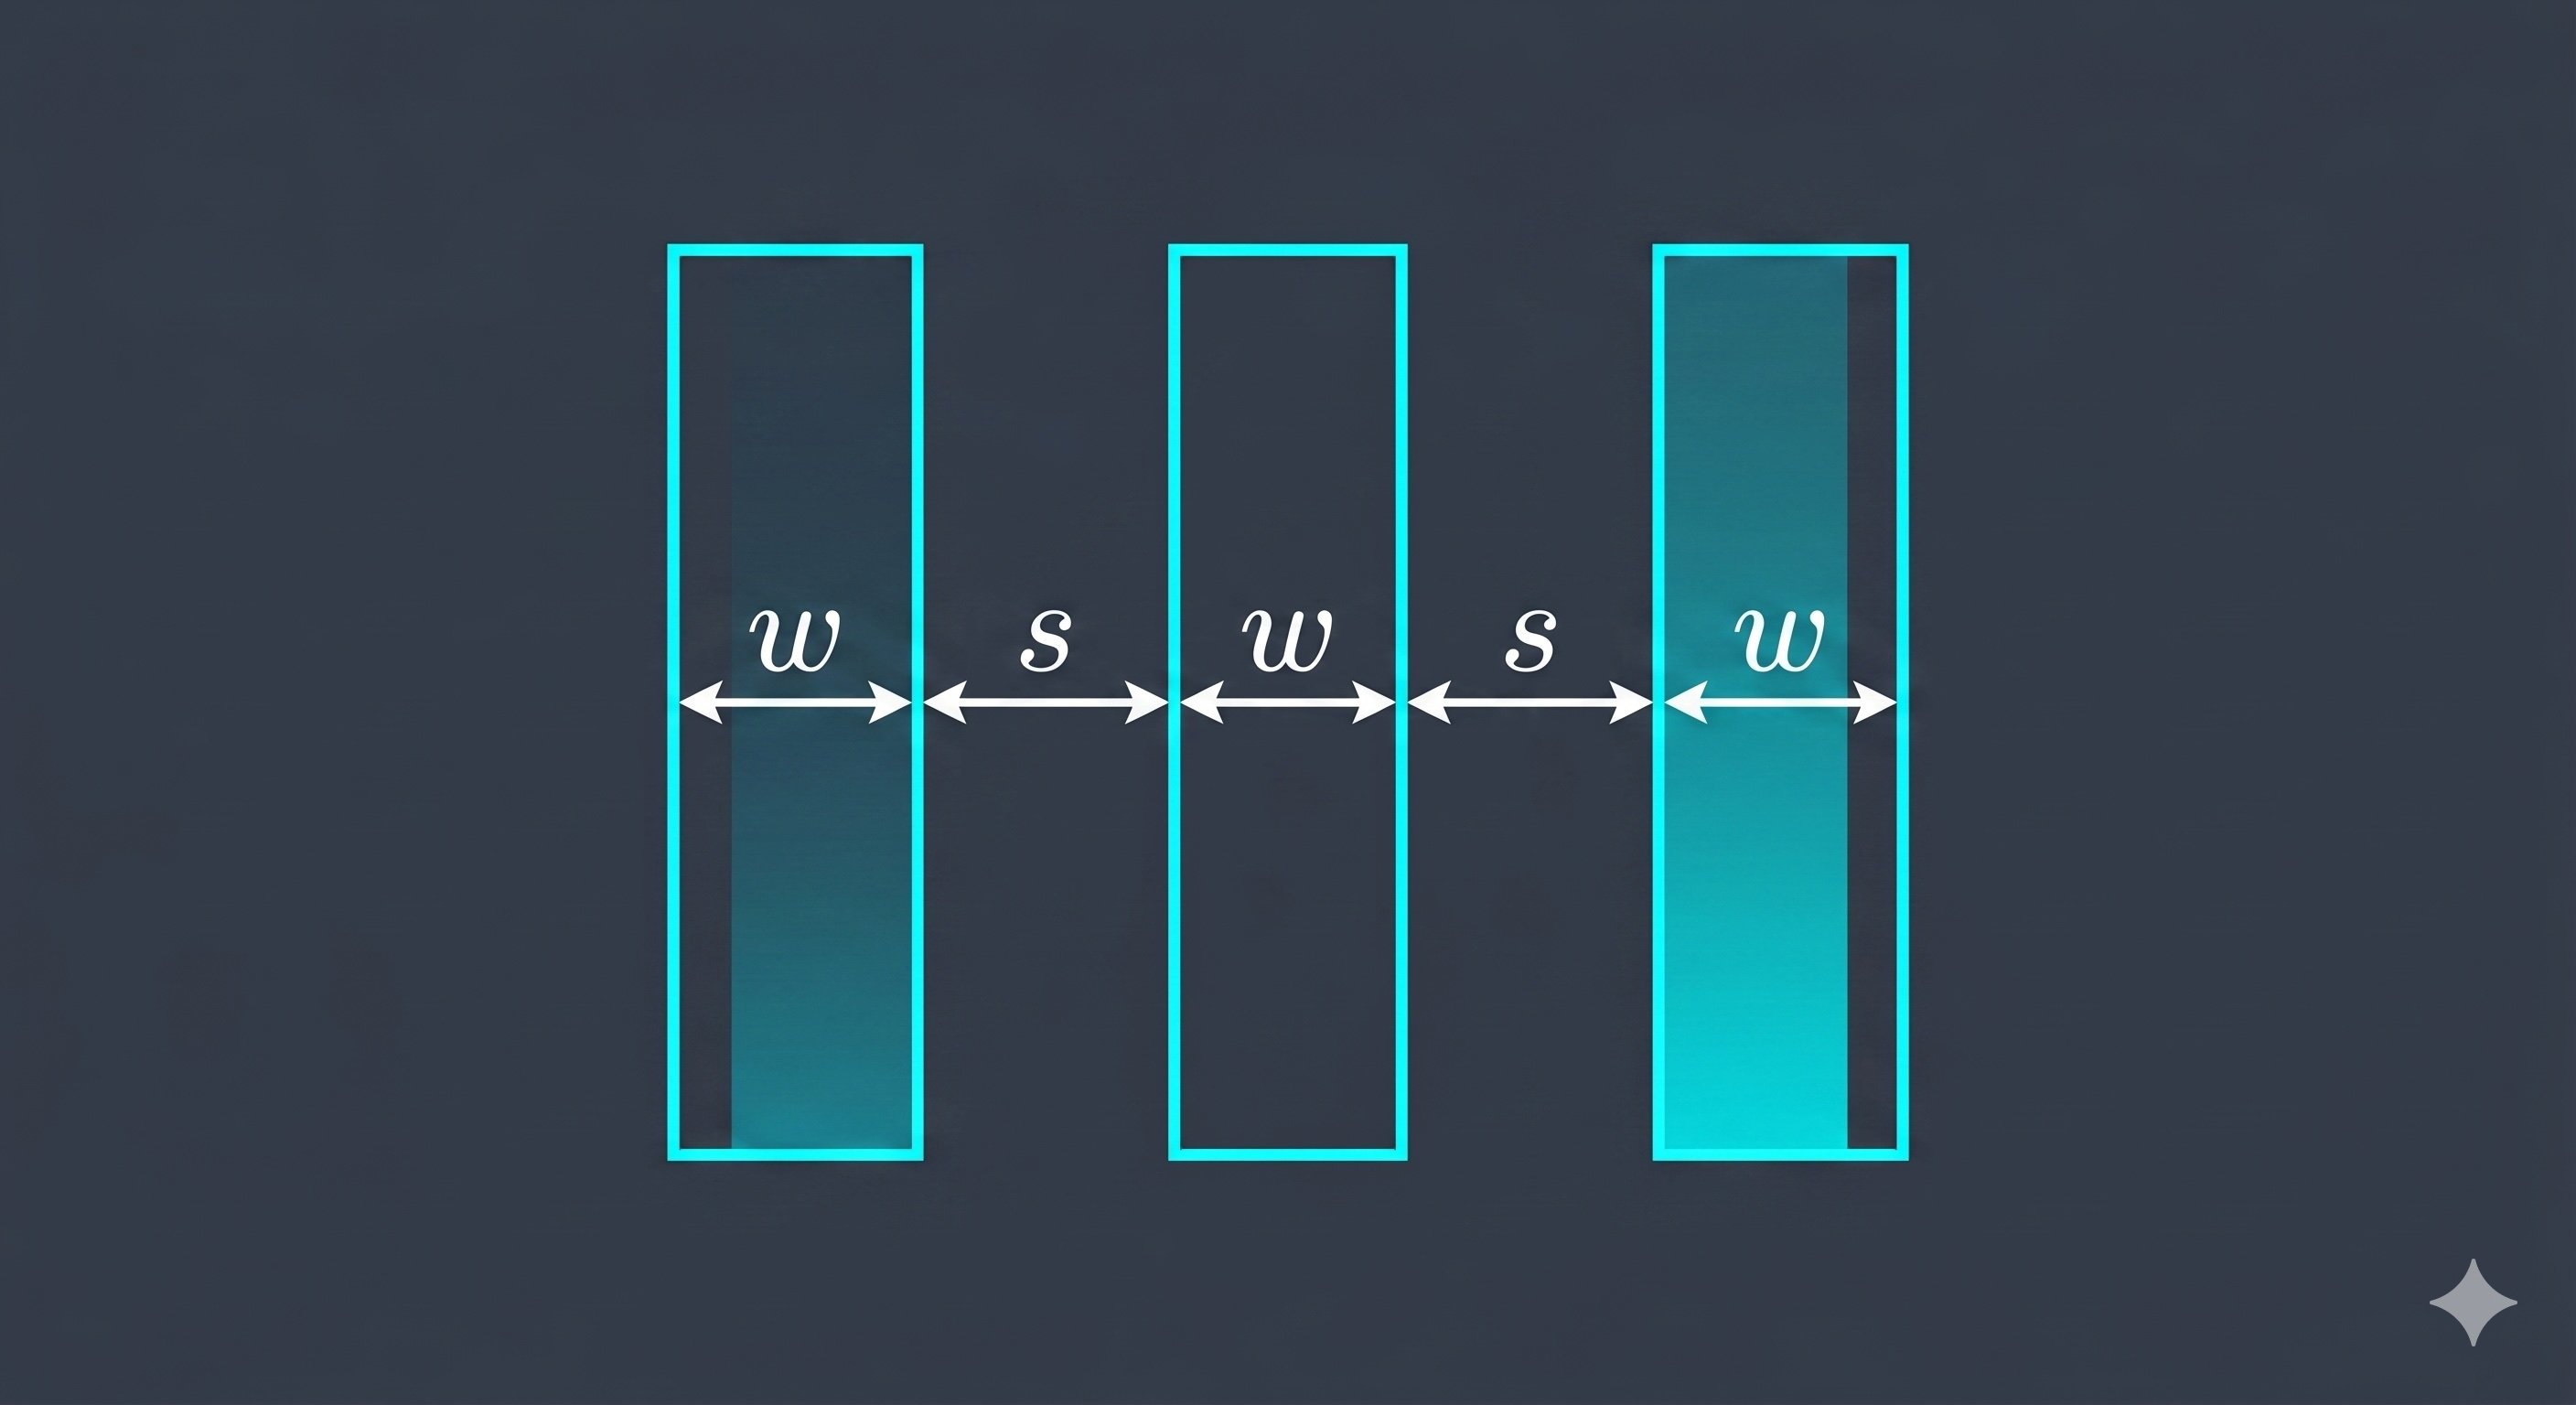
To prevent visual confusion, a standard bar graph must follow strict geometric rules regarding bar width, bar spacing, and scale intervals.
Key Points
- All rectangular bars in a bar graph must have exactly equal width.
- The gaps or spacing between adjacent bars must remain perfectly equal throughout.
- The numerical scale on the axis must grow by uniform intervals (e.g., counting by , , or ).
Olympiad Fact
If the spacing or width of bars is drawn unequally, the graph is mathematically distorted and can mislead the viewer about the real proportions of the data!
Interpreting Bar Graphs
Reading the Columns
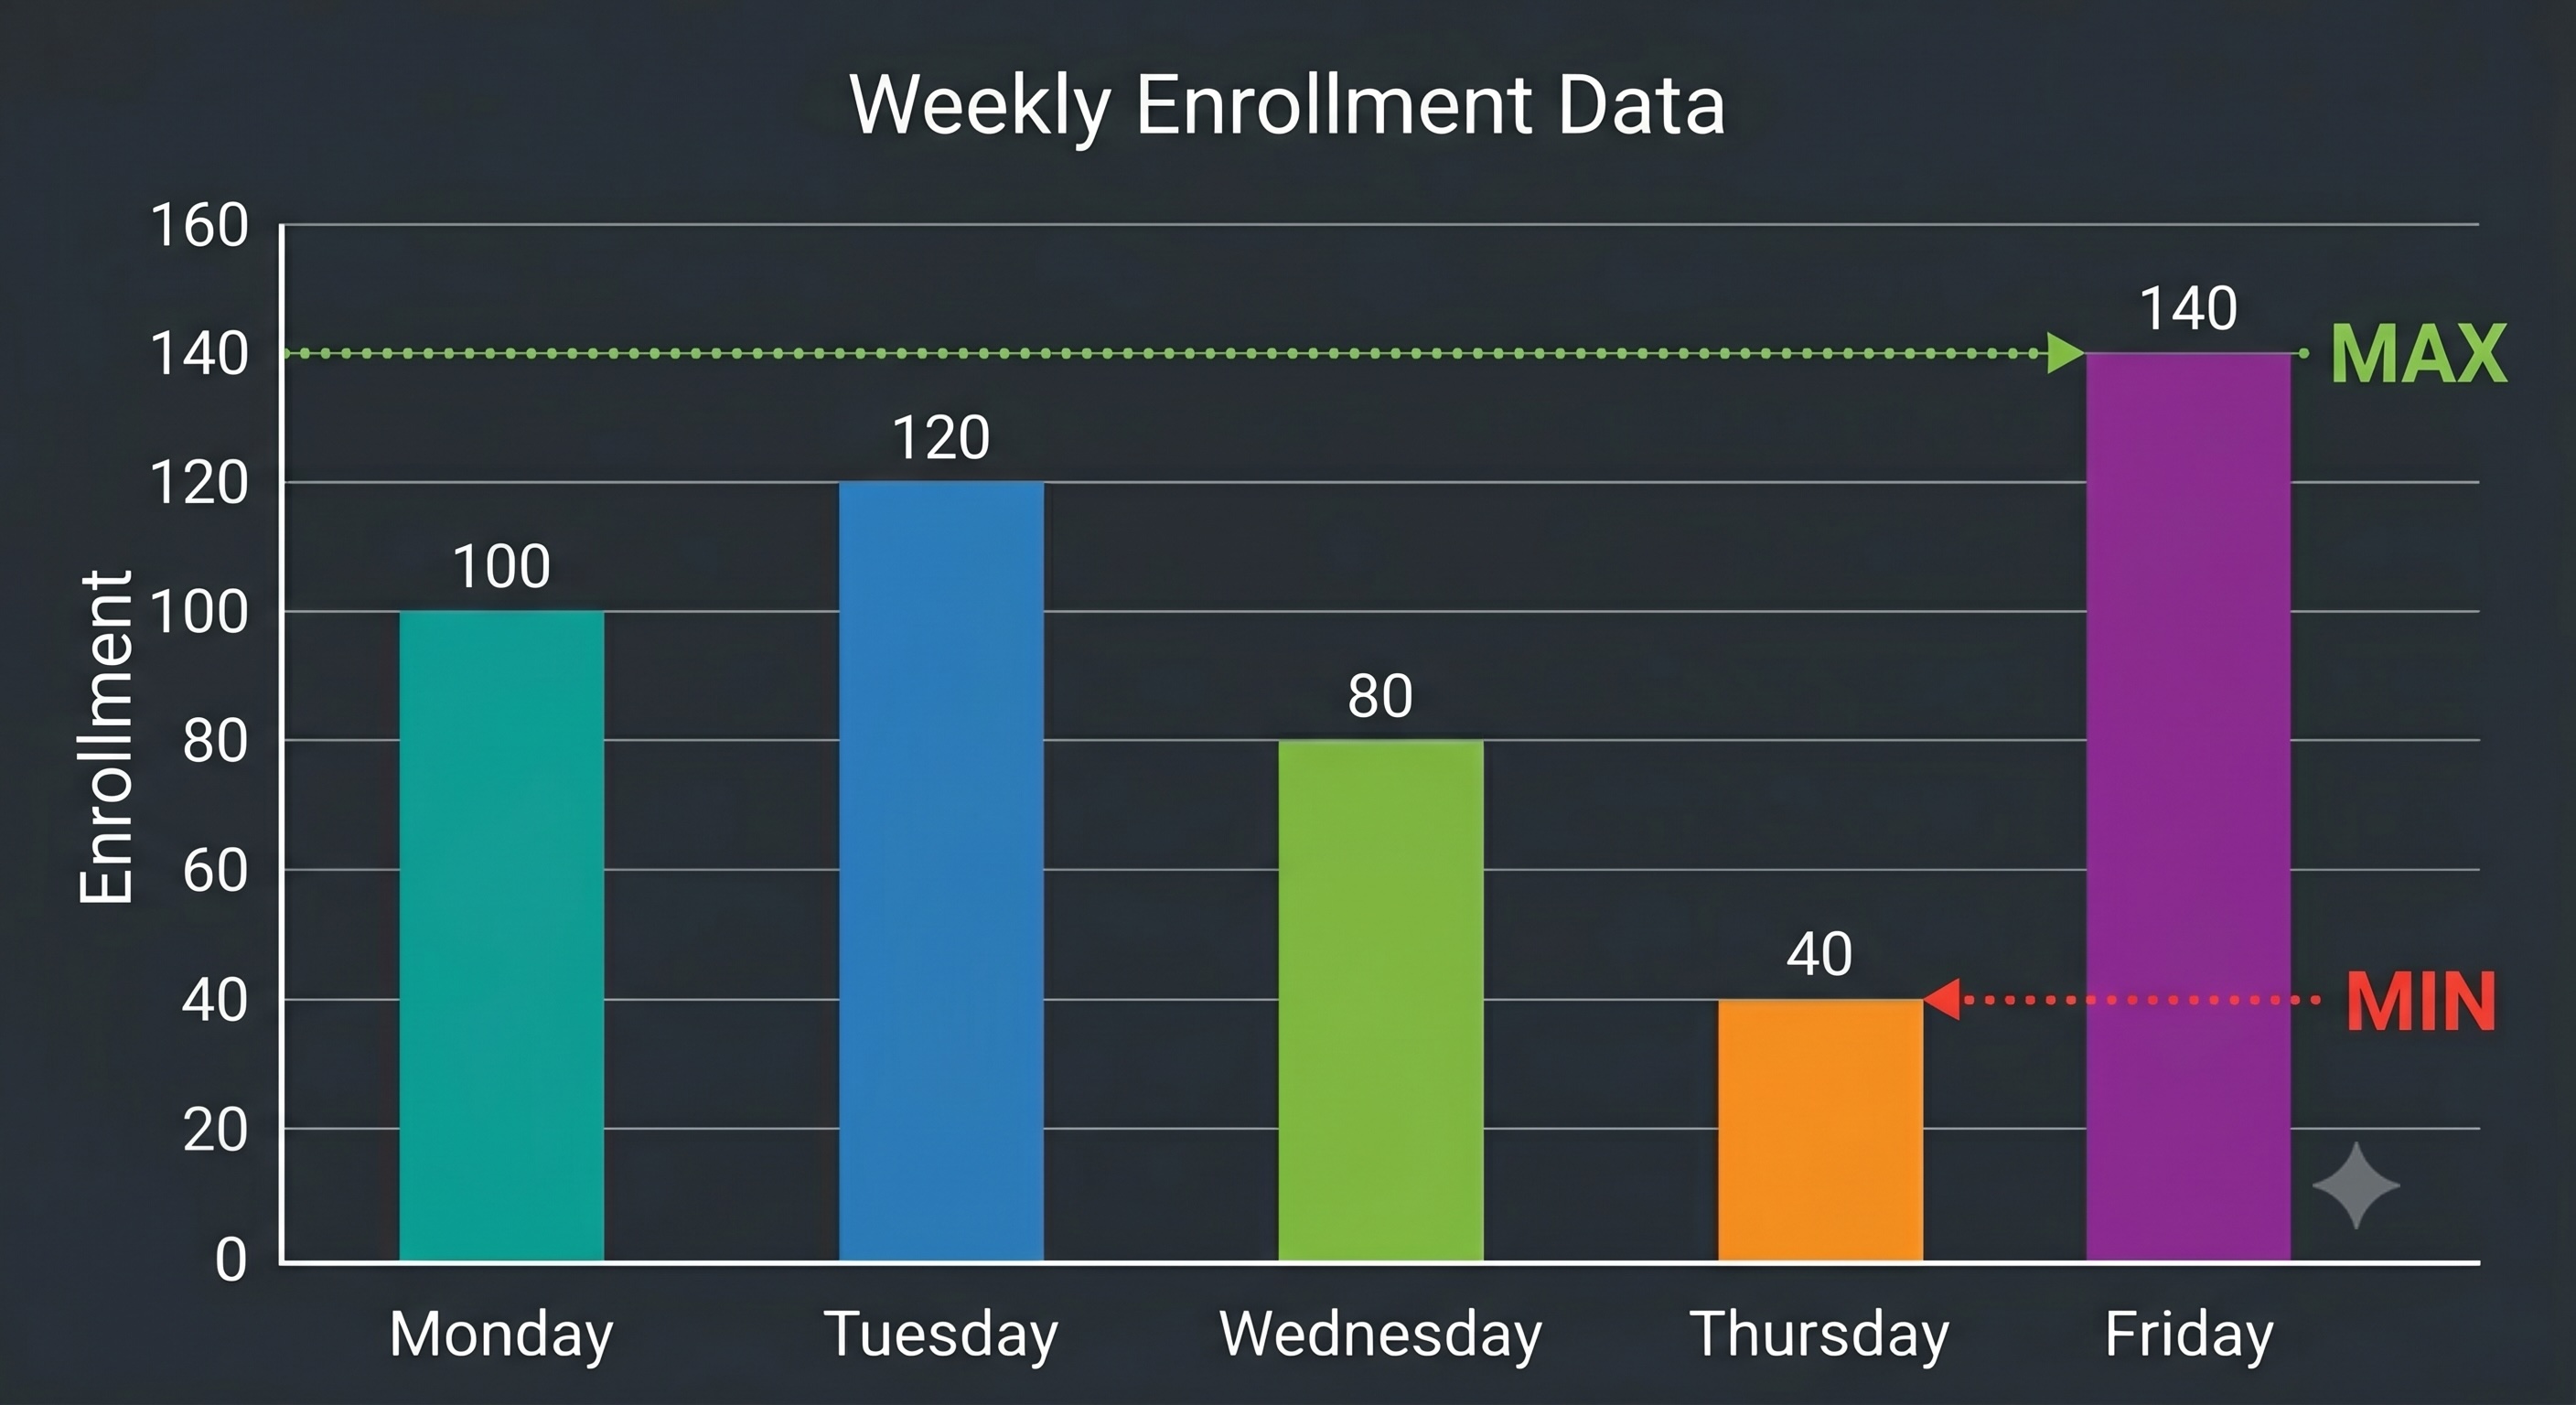
Interpreting a bar graph involves scanning the heights of the bars against the numerical axis to extract exact values and compare categories.
Key Points
- The highest bar in a graph represents the category with the maximum frequency.
- The lowest bar in a graph represents the category with the minimum frequency.
- You can find differences between categories by comparing the height values directly.
Olympiad Fact
Olympiad problems often ask for the total sum of all categories combined; always read each bar's value carefully, list them, and sum them systematically.
Swipe to skip‹